

Refer to Figure 4. 2 in the textbook. This graph demonstrates that the marginal pollution-damage cost (MDC)
Question:
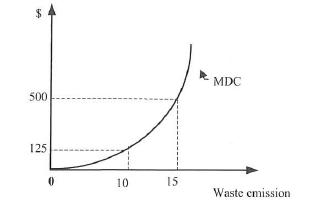
Refer to Figure 4. 2 in the textbook. This graph demonstrates that the marginal pollution-damage cost (MDC) of each successive unit of pollution is incrementally rising at an increasing rate. What ecological factor is said to explain this phenomenon? Be specific.
Data from Figure 4. 2
Step by Step Answer:

This question has not been answered yet.
You can Ask your question!
Related Book For 
Principles Of Environmental Economics And Sustainability
ISBN: 9780815363545
4th Edition
Authors: Ahmed Hussen
Question Posted:
