

Suppose that the supply curve in the top panel of Figure 7.5 represents MC Private , and
Question:
Suppose that the supply curve in the top panel of Figure 7.5 represents MCPrivate, and that the demand curve represents MB social Draw an private MC social curve such that Q* is the efficient level of output. Besides a price ceiling, what other policy could reduce output to Q*?
Figure 7.5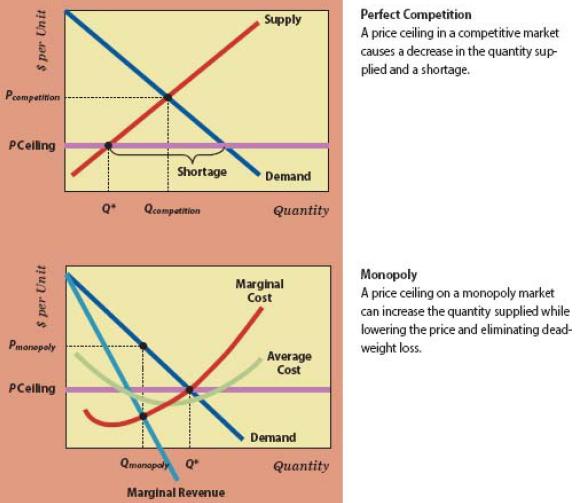
Step by Step Answer:

This question has not been answered yet.
You can Ask your question!
Related Book For 

Environmental Economics And Natural Resource Management
ISBN: 9780415640954
4th Edition
Authors: David A. Anderson
Question Posted:
