

The marginal cost of reduction curve illustrated in Figure 4.5 assumes a particular approach to reducing pollution,
Question:
The marginal cost of reduction curve illustrated in Figure 4.5 assumes a particular approach to reducing pollution, often called end-of-the-pipe control. In other words, when we draw that upward-sloping MC curve, we assume that firms respond to regulation by maintaining the same basic production technology but adding on scrubbers or filters to clean up their emissions. Under these conditions, rising marginal costs of reduction are quite likely.
Figure 4.5
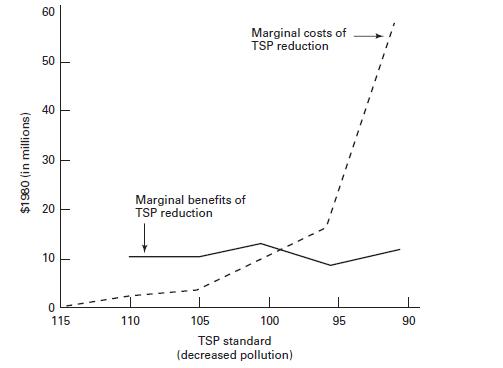 However, suppose that firms radically overhaul their production technology, so that they completely eliminate emissions. This is known as a “pollution prevention” strategy. An example might be a jeweler, who in the face of regulation adopts a closed-loop production system. This is one in which all mineral waste products are recovered from recycled wastewater and then reused. What would the marginal cost of reduction diagram look like in this case?
a. Specifically, assume that reducing metal pollution by the first 1% required the installation of a $100,000 recycling system, but that the marginal cost of further reduction was zero. Draw the marginal cost of reduction curve.
b. Let the marginal benefit of reduction curve be equal to $(30, 000 − 1/3 ∗ x), where x is the percentage reduction in pollution (ranging from0%to 100%). In this case, is installation of the recycling system efficient? What is the efficient cleanup level?
Step by Step Answer:

This question has not been answered yet.
You can Ask your question!

Economics And The Environment
ISBN: 9781118539729
7th Edition
Authors: Eban S. Goodstein, Stephen Polasky
