

An early graphical method for comparing nucleotide sequencesthe so-called diagon plotstill yields one of the best visual
Question:
An early graphical method for comparing nucleotide sequences—the so-called diagon plot—still yields one of the best visual comparisons of sequence relatedness. An example is illustrated in Figure Q9–11, in which the human β-globin gene is compared with the human cDNA for β globin (which contains only the coding portion of the gene; Figure Q9–11A) and with the mouse β-globin gene (Figure Q9–11B). Diagon plots are generated by comparing blocks of sequence, in this case blocks of 11 nucleotides at a time. If 9 or more of the nucleotides match, a dot is placed on the diagram at the coordinates corresponding to the blocks being compared. A comparison of all possible blocks generates diagrams such as the ones shown in Figure Q9–11, in which sequence similarities show up as diagonallines.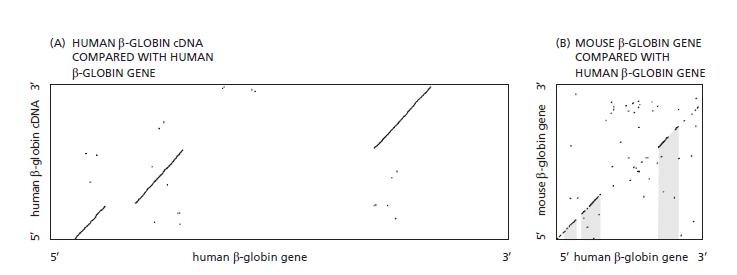
A. From the comparison of the human β-globin gene with the human β-globin cDNA (Figure Q9–11A), can you deduce the positions of exons and introns in the β-globin gene?
B. Are the exons of the human β-globin gene (indicated by shading in Figure Q9–11B) similar to those of the mouse β-globin gene? Identify and explain any key differences.
C. Is there any sequence similarity between the human and mouse β-globin genes that lies outside the exons? If so, identify its location and offer an explanation for its preservation during evolution.
D. Did the mouse or human gene undergo a change of intron length during their evolutionary divergence? How can you tell?
Step by Step Answer:
A From the comparison of the human globin gene with the human globin cDNA Figure Q911A it is possible to deduce the positions of exons and introns in ...View the full answer


Essential Cell Biology
ISBN: 9780393680362
5th Edition
Authors: Bruce Alberts, Karen Hopkin, Alexander Johnson, David Morgan, Martin Raff, Keith Roberts, Peter Walter
