

Carefully consider the graph in Figure 2043, which shows the number of cases of colon cancer diagnosed
Question:
Carefully consider the graph in Figure 20−43, which shows the number of cases of colon cancer diagnosed per 100,000 women per year as a function of age. Why is this graph so steep and curved, if mutations occur with a similar frequency throughout a person’s life-span?
Figure 20−43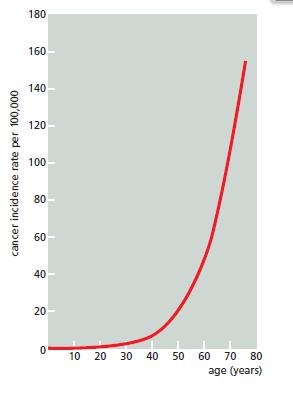
Fantastic news! We've Found the answer you've been seeking!
Step by Step Answer:
The steep and curved shape of the graph showing the number of colon cancer cases diagnosed per 100000 women per year as a function of age can be attri...View the full answer

Answered By
User l_917591
As a Business Management graduate from Moi University, I had the opportunity to work as a tutor for undergraduate students in the same field. This experience allowed me to apply the theoretical knowledge I had gained in a practical setting, while also honing my teaching and communication skills.
As a tutor, I was responsible for conducting tutorial sessions, grading assignments and exams, and providing feedback and support to my students. I also assisted with the preparation of course materials and collaborated with other tutors and professors to ensure consistency in teaching and assessment.
0 Reviews
10+ Question Solved
Related Book For 

Essential Cell Biology
ISBN: 9780393680362
5th Edition
Authors: Bruce Alberts, Karen Hopkin, Alexander Johnson, David Morgan, Martin Raff, Keith Roberts, Peter Walter
Question Posted:
