

Predicting Prices of Used Cars (Regression Trees). The file ToyotaCorolla.csv contains the data on used cars (Toyota
Question:
Predicting Prices of Used Cars (Regression Trees). The file ToyotaCorolla.csv contains the data on used cars (Toyota Corolla) on sale during late summer of 2004 in the Netherlands. It has 1436 records containing details on 38 attributes, including Price, Age, Kilometers, HP, and other specifications. The goal is to predict the price of a used Toyota Corolla based on its specifications. (The example in Section 9.7 is a subset of this dataset.) Data Preprocessing. Split the data into training (60%), and holdout (40%) datasets.
a. Run a full-grown regression tree with target attribute Price and predictors Age_08_04, KM, Fuel_Type (first convert to dummies), HP, Automatic, Doors, Quarterly_Tax, Mfr_Guarantee, Guarantee_Period, Airco, Automatic_airco, CD_Player, Powered_Windows, Sport_Model, and Tow_Bar.
i. Which appear to be the three or four most important car specifications for predicting the car’s price?
ii. Compare the prediction errors of the training and holdout sets by examining their RMS error and by plotting the two boxplots. (Note: Use the Generate Attributes operator to compute the prediction errors as a new attribute.) How does the predictive performance of the holdout set compare to the training set? Why does this occur?
iii. How might we achieve better holdout predictive performance at the expense of training performance?
iv. Create a smaller tree by using Optimize Parameters (Grid) with cv = 5 to find a fine-tuned tree. Compared to the full-grown tree, what is the predictive performance on the holdout set?
b. Let us see the effect of turning the price attribute into a categorical attribute. First, create a new attribute that categorizes price into 20 bins. Now repartition the data keeping Binned_Price instead of Price. Run a classification tree with the same set of predictors as in the RT, and with Binned_Price as the target attribute. As in the less deep regression tree, create a smaller tree by using Optimize Parameters (Grid) with cv = 5 to find a fine-tuned tree.
i. Compare the smaller tree generated by the CT with the smaller tree generated by RT. Are they different? (Look at structure, the top predictors, size of tree, etc.) Why?
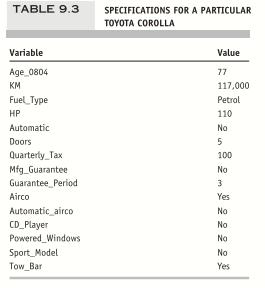
ii. Predict the price, using the smaller RT and CT, of a used Toyota Corolla with the specifications listed in Table 9 .3.
iii. Compare the predictions in terms of the predictors that were used, the magnitude of the difference between the two predictions, and the advantages and disadvantages of the two methods.
Step by Step Answer:


Machine Learning For Business Analytics
ISBN: 9781119828792
1st Edition
Authors: Galit Shmueli, Peter C. Bruce, Amit V. Deokar, Nitin R. Patel
