

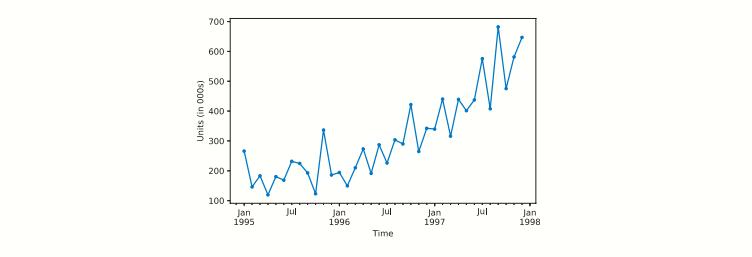
The time plot in Figure 19.18 describes monthly sales of a certain shampoo over a three-year period.
Question:
The time plot in Figure 19.18 describes monthly sales of a certain shampoo over a three-year period. [Data are available in ShampooSales.csv, Source: Hyndman and Yang (2018).]
Which of the following methods would be suitable for forecasting this series if applied to the raw data?
• Moving average
• Simple exponential smoothing
• Double exponential smoothing
• Holt-Winters exponential smoothing
Step by Step Answer:

This question has not been answered yet.
You can Ask your question!
Related Book For 

Machine Learning For Business Analytics
ISBN: 9781119828792
1st Edition
Authors: Galit Shmueli, Peter C. Bruce, Amit V. Deokar, Nitin R. Patel
Question Posted:
