

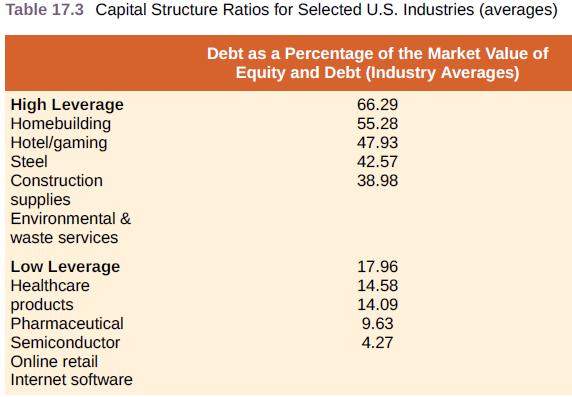
Refer to the observed capital structures given in Table 17.3 of the text. What do you notice
Question:
Refer to the observed capital structures given in Table 17.3 of the text. What do you notice about the types of industries with respect to their average debt-equity ratios? Are certain types of industries more likely to be highly leveraged than others? What are some possible reasons for this observed segmentation? Do the operating results and tax history of the firms play a role? How about their future earnings prospects? Explain.
Fantastic news! We've Found the answer you've been seeking!
Step by Step Answer:
The more capital intensive industries such as air transport tel...View the full answer

Answered By
Ali Khawaja
my expertise are as follows: financial accounting : - journal entries - financial statements including balance sheet, profit & loss account, cash flow statement & statement of changes in equity -consolidated statement of financial position. -ratio analysis -depreciation methods -accounting concepts -understanding and application of all international financial reporting standards (ifrs) -international accounting standards (ias) -etc business analysis : -business strategy -strategic choices -business processes -e-business -e-marketing -project management -finance -hrm financial management : -project appraisal -capital budgeting -net present value (npv) -internal rate of return (irr) -net present value(npv) -payback period -strategic position -strategic choices -information technology -project management -finance -human resource management auditing: -internal audit -external audit -substantive procedures -analytic procedures -designing and assessment of internal controls -developing the flow charts & data flow diagrams -audit reports -engagement letter -materiality economics: -micro -macro -game theory -econometric -mathematical application in economics -empirical macroeconomics -international trade -international political economy -monetary theory and policy -public economics ,business law, and all regarding commerce
1+ Reviews
10+ Question Solved
Related Book For 
Corporate Finance
ISBN: 978-1259918940
12th edition
Authors: Stephen Ross, Randolph Westerfield, Jeffrey Jaffe, Bradford Jordan
Question Posted:
