

A stocks price/earnings (P/E) ratio is the per-share price of its stock divided by the companys annual
Question:
A stock’s price/earnings (P/E) ratio is the per-share price of its stock divided by the company’s annual earnings per share. The P/E ratio for the stock market as a whole is used by some analysts as a measure of whether stocks are cheap or expensive, in comparison with other historical periods. Table 3.3 shows some annual P/E ratios for the New York Stock Exchange (NYSE). Calculate the mean and standard deviation. The stock market reached a peak in August 1987, when the Dow Jones Industrial Average topped 2,700. The Dow slipped back to 2,500 in October of 1987 and then to 2,250. Then, on a single day, October 19, 1987, the Dow fell by 508 points. At its August 1987 peak, the market’s price/earnings ratio was 23. Was this P/E value more than two standard deviations above the mean P/E for 1970–1986? Was it more than 1.5 times the interquartile range above the median? Draw a box-and-whiskers diagram using these 1970–1986 P/E data.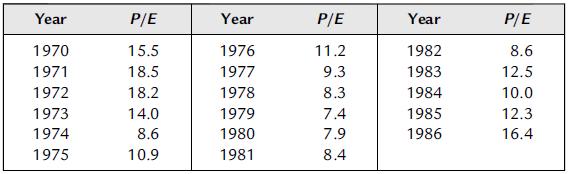
Step by Step Answer:

This question has not been answered yet.
You can Ask your question!


Essential Statistics Regression And Econometrics
ISBN: 9780123822215
1st Edition
Authors: Gary Smith
