

Eighteen plots of land in Indiana were given different applications of nitrogen. In each case, the previous
Question:
Eighteen plots of land in Indiana were given different applications of nitrogen. In each case, the previous crop had been soybeans and all other factors were roughly comparable. Use the 18 observations in Table 9.16 to estimate the equation Y = α + βX + ε, where Y is the corn yield (bushels per acre) and X is nitrogen (pounds per acre). Is the relationship substantial and statistically significant at the 1 percent level?
Now make a scatter diagram with the residuals on the vertical axis and X on the horizontal axis and a horizontal line drawn at 0. What pattern do you see and how do you explain it?
Does this pattern make logical sense?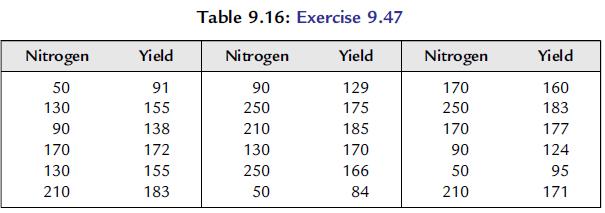
Fantastic news! We've Found the answer you've been seeking!
Step by Step Answer:

Answered By
Susan Juma
I'm available and reachable 24/7. I have high experience in helping students with their assignments, proposals, and dissertations. Most importantly, I'm a professional accountant and I can handle all kinds of accounting and finance problems.
15+ Reviews
45+ Question Solved
Related Book For 

Essential Statistics Regression And Econometrics
ISBN: 9780123822215
1st Edition
Authors: Gary Smith
Question Posted:
