

In 1992, two UCLA professors compared the trends over time in male and female world records in
Question:
In 1992, two UCLA professors compared the trends over time in male and female world records in several running events. Their data (in minutes) for the marathon, a race covering 42,195 meters, are in Table 2.17. Convert each of these times to velocity, in meters per minute, by dividing 42,195 meters by the time. Then plot the velocity data on a single time series graph, with the velocity axis running from 0 to 400 and the time axis running from 1900 to 2000. (Plot each point at the midpoint of the decade; for example, plot the 1910s data at 1915.) The professors wrote that,
“Despite the potential pitfalls, we could not resist extrapolating these record progressions into the future.” Draw one freehand straight line that fits the male data and another that fits the female data. Do these lines cross before 2000? Extrapolating the female line backward, what was the implied female world record in 1900?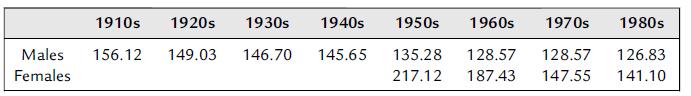
Step by Step Answer:

This question has not been answered yet.
You can Ask your question!


Essential Statistics Regression And Econometrics
ISBN: 9780123822215
1st Edition
Authors: Gary Smith
