

Table 8.10 shows cricket chirps per minute and temperature in degrees Fahrenheit for the striped ground cricket
Question:
Table 8.10 shows cricket chirps per minute and temperature in degrees Fahrenheit for the striped ground cricket [11]. Which is the dependent variable? Draw a scatter diagram with the cricket chirps axis running from 0 to 20, and the temperature axis running from 60 to 100. Does the relationship seem linear? Estimate the equation Y = α + βX + ε by least squares and draw this fitted line in your scatter diagram. In ordinary English, interpret your estimate of the slope.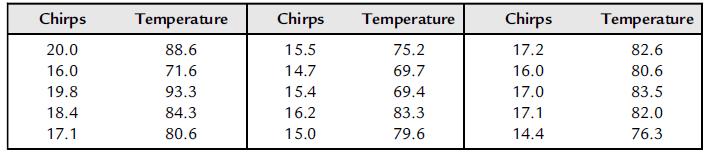
Step by Step Answer:

This question has not been answered yet.
You can Ask your question!
Related Book For 

Essential Statistics Regression And Econometrics
ISBN: 9780123822215
1st Edition
Authors: Gary Smith
Question Posted:
