

The data in Exercise 9.39 were used to calculate the annual percentage change in real per capita
Question:
The data in Exercise 9.39 were used to calculate the annual percentage change in real per capita disposable personal income, gt = 100(Yt − Yt−1)/Yt−1 (Table 11.4).
a. Use least squares to estimate the relationship between this year’s growth rate and the previous year’s growth rate: gt = α + βgt−1 + ε.
b. Based on your estimates of α and β, what is the dynamic equilibrium value of g?
c. Based on your estimates of α and β, is the growth rate monotonically stable, cyclically stable, monotonically unstable, or cyclically unstable?
d. Why do you think that the model gt = α + βgt−1 is not an adequate guide to whether g converges to a dynamic equilibrium value?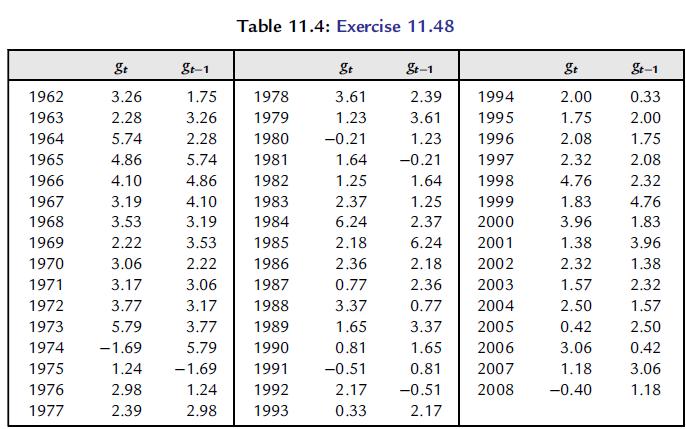
Exercise 9.39
Table 9.15 shows U.S. data for C = real per capita consumption and Y = real per capita disposable personal income.
a. Draw a scatter diagram.
b. Estimate the consumption function C = α + βY + ε.
c. Calculate the residuals e = C − (a + bY) for each year and make a scatter diagram with e on the vertical axis and the year on the horizontal axis.
d. Do you see anything in this residuals plot that suggests that the least squares assumptions might be violated?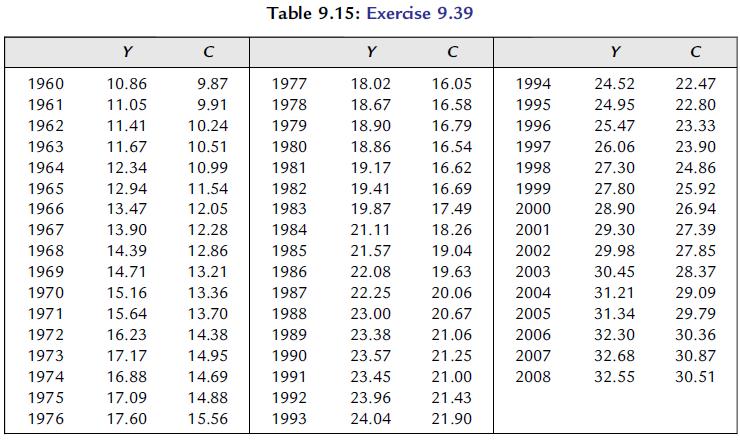
Step by Step Answer:

This question has not been answered yet.
You can Ask your question!


Essential Statistics Regression And Econometrics
ISBN: 9780123822215
1st Edition
Authors: Gary Smith
