

Thirty-five male college seniors were asked how many biological children they expect to have during their lifetimes.
Question:
Thirty-five male college seniors were asked how many biological children they expect to have during their lifetimes. Figure 3.10 is a histogram summarizing their answers:
Of these four numbers (0, 1.4, 2.4, 3.0), one is the mean, one is the median, one is the standard deviation, and one is irrelevant. Identify which number is which.
a. Mean.
b. Median.
c. Standard deviation.
d. Irrelevant.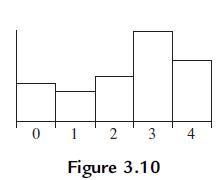
Fantastic news! We've Found the answer you've been seeking!
Step by Step Answer:

Answered By
Akshay Agarwal
I am a Post-Graduate with a specialization in Finance. I have been working in the Consulting industry for the past 8 years with a focus on the Corporate and Investment Banking domain. Additionally, I have been involved in supporting student across the globe in their academic assignments and always strive to provide high quality support in a timely manner. My notable achievements in the academic field includes serving more than 10,000 clients across geographies on various courses including Accountancy, Finance, Management among other subjects. I always strive to serve my clients in the best possible way ensuring high quality and well explained solutions, which ensures high grades for the students along-with ensuring complete understanding of the subject matter for them. Further, I also believe in making myself available to the students for any follow-ups and ensures complete support and cooperation throughout the project cycle. My passion in the academic field coupled with my educational qualification and industry experience has proved to be instrumental in my success and has helped me stand out of the rest. Looking forward to have a fruitful experience and a cordial working relationship.
179+ Reviews
294+ Question Solved
Related Book For 

Essential Statistics Regression And Econometrics
ISBN: 9780123822215
1st Edition
Authors: Gary Smith
Question Posted:
