

To examine the relationship between the death penalty and murder rates, the following equation was estimated by
Question:
To examine the relationship between the death penalty and murder rates, the following equation was estimated by least squares using U.S. cross-sectional data for 50 states: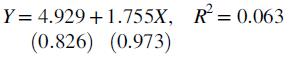
where Y = murder rate (murders per 100,000 residents), X = 1 if the state has a death penalty or 0 if it does not, and the standard errors are in parentheses.
a. What does R2 mean and how is it measured?
b. Is the relationship statistically significant at the 5 percent level?
c. The researcher added the District of Columbia to the data and obtained these results: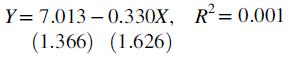
The murder rate in D.C. is 36.2; the state with the next highest murder rate is Michigan, with a murder rate of 12.2. Explain how a comparison of the two estimated equations persuades you that D.C. either does or does not have a death penalty.
d. Explain the error in this interpretation of the results including D.C.: “Those of us who oppose the death penalty can breathe a sigh of relief, now armed with statistically significant evidence that the death penalty is only cruel and not effective.”
Step by Step Answer:


Essential Statistics Regression And Econometrics
ISBN: 9780123822215
1st Edition
Authors: Gary Smith
