

Use the data in Exercise 9.39 to calculate the annual percentage change in income and consumption, for
Question:
Use the data in Exercise 9.39 to calculate the annual percentage change in income and consumption, for example, in 1961![]()
a. Draw a scatter diagram using these annual percentage changes.
b. Estimate the consumption function (%C) = α+β(%Y)+ε.
Exercise 9.37
Consider the hypothetical income and spending data in Table 9.14.
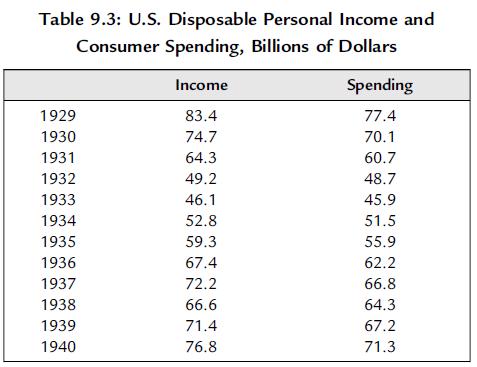
a. Identify any important differences in the patterns in these data compared to the data in Table 9.3.
b. Estimate the simple regression model with spending as the dependent variable and income as the explanatory variable.
c. Calculate the annual percentage changes in income and spending and estimate the simple regression model with the percentage change in spending as the dependent variable and the percentage change in income as the explanatory variable.
d. Identify any important differences between your answers to questions b and c.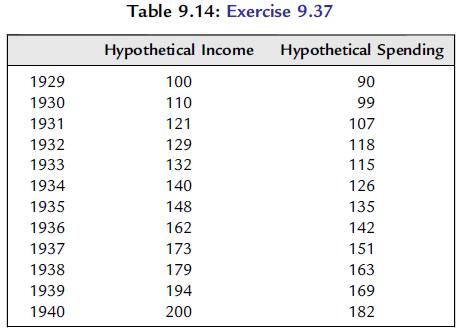
c. Calculate the residuals e = (%C)−[a+b(%Y)] for each year and make a scatter diagram with e on the vertical axis and the year on the horizontal axis.
d. Do you see anything in this residuals plot that suggests that the least squares assumptions might be violated?
Step by Step Answer:

This question has not been answered yet.
You can Ask your question!


Essential Statistics Regression And Econometrics
ISBN: 9780123822215
1st Edition
Authors: Gary Smith
