

Use these household taxable income data (in thousands of dollars) to make a histogram, using intervals equal
Question:
Use these household taxable income data (in thousands of dollars) to make a histogram, using intervals equal to the federal income tax brackets shown in Table 2.5: 12, 15, 23, 24, 32, 37, 37, 37, 48, 48, 52, 59, 75, 80, 80, 85, 110, 114, 130, 150.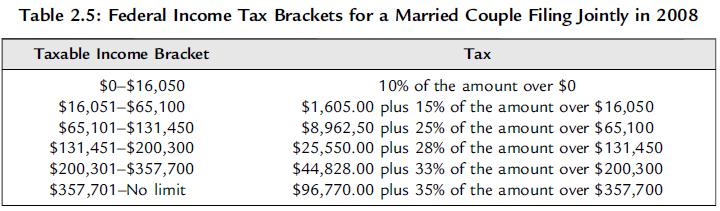
Fantastic news! We've Found the answer you've been seeking!
Step by Step Answer:

Answered By
Sumit kumar
I am an experienced online essay writer with a thorough understanding of any curriculum.and subject expert at Chegg for mathematics, CS subjects..
5+ Reviews
13+ Question Solved
Related Book For 

Essential Statistics Regression And Econometrics
ISBN: 9780123822215
1st Edition
Authors: Gary Smith
Question Posted:
