

In the following graph, reproduced from the answer to Solved Problem 11.3, indicate the area representing the
Question:
In the following graph, reproduced from the answer to Solved Problem 11.3, indicate the area representing the Red Robin restaurant’s profit when the demand curve is D1 and the area representing its loss when the demand curve is D2.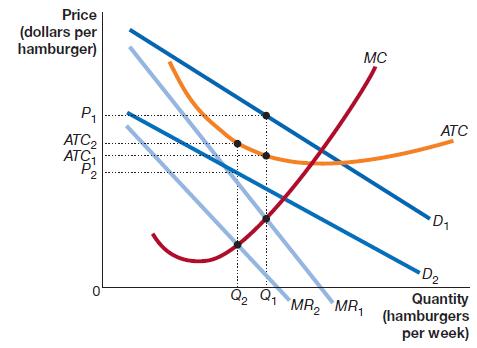
Step by Step Answer:

This question has not been answered yet.
You can Ask your question!
Related Book For 

Essentials Of Economics
ISBN: 9780134797731
6th Edition
Authors: R. Glenn Hubbard, Anthony Patrick O brien
Question Posted:
