

The accompanying figure shows new U.S. housing starts, in thousands of units per month, between January 1980
Question:
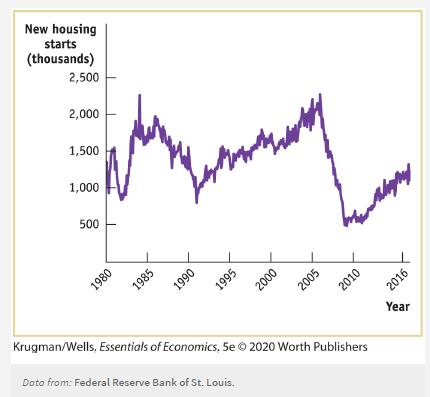
The accompanying figure shows new U.S. housing starts, in thousands of units per month, between January 1980 and December 2016. The graph shows a large drop in new housing starts from 1984–1991 and 2006–2009. New housing starts are related to the availability of mortgages.
a. What caused the drop in new housing starts from 1984–1991?
b. What caused the drop in new housing starts from 2006–2009?
c. How could better regulation of financial institutions have prevented these two instances?
Step by Step Answer:

This question has not been answered yet.
You can Ask your question!
Related Book For 

Question Posted:
