

The following tables present returns on various pairs of stocks in several periods. In part A, we
Question:
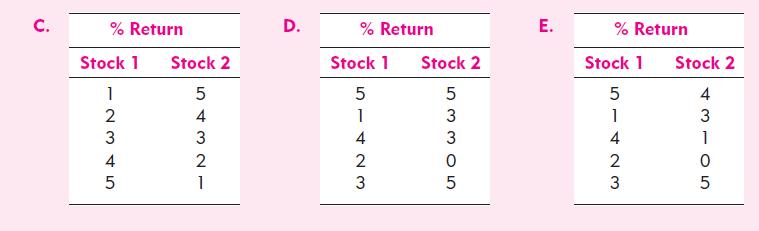
The following tables present returns on various pairs of stocks in several periods. In part A, we show you a scatter diagram of the returns on the first pair of stocks. Draw (or prepare in Excel) similar scatter diagrams for cases B through E. Match up the diagrams (A–E) to the following list of correlation coefficients by choosing the correlation that best describes the relationship between the returns on the two stocks: ρ = 1, 0, 0.2, 0.5, 1.0.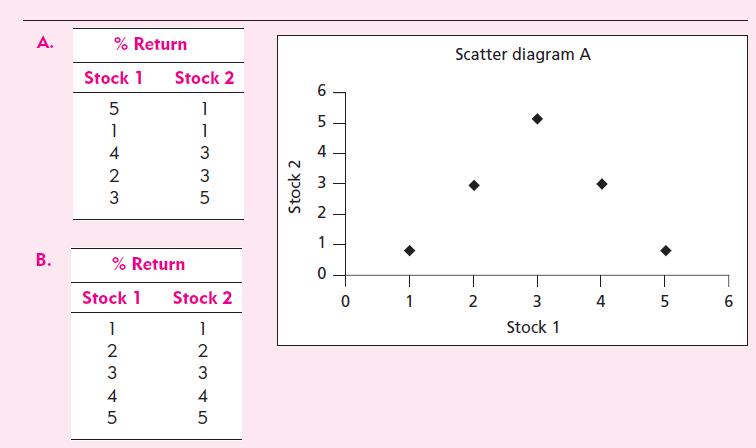
Fantastic news! We've Found the answer you've been seeking!
Step by Step Answer:

Answered By
Utsab mitra
I have the expertise to deliver these subjects to college and higher-level students. The services would involve only solving assignments, homework help, and others.
I have experience in delivering these subjects for the last 6 years on a freelancing basis in different companies around the globe. I am CMA certified and CGMA UK. I have professional experience of 18 years in the industry involved in the manufacturing company and IT implementation experience of over 12 years.
I have delivered this help to students effortlessly, which is essential to give the students a good grade in their studies.
2+ Reviews
10+ Question Solved
Related Book For 
Essentials Of Investments
ISBN: 9780073368719
7th Edition
Authors: Zvi Bodie, Alex Kane, Alan J. Marcus
Question Posted:
