

Exercise 5.46 presented data on x = squawfish length and y = maximum size of salmonid consumed,
Question:
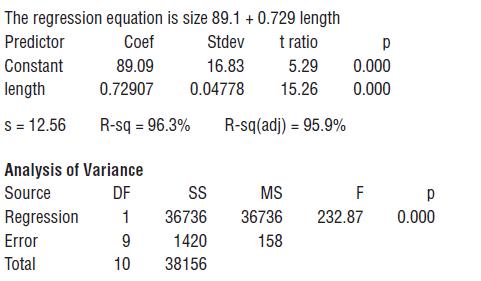
Exercise 5.46 presented data on x = squawfish length and y = maximum size of salmonid consumed, both in mm. Use the accompanying MINITAB output along with the values x̅ = 343.27 and Sxx = 69,112.18 to answer the following questions.
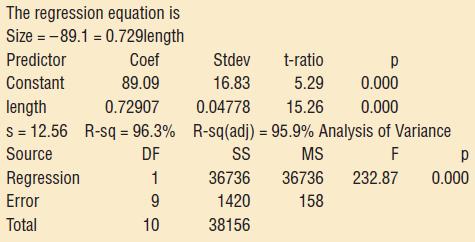
a. Does there appear to be a useful linear relationship between length and size?
b. Does it appear that the average change in maximum size associated with a 1-mm increase in length is less than .8 mm? State and test the appropriate hypotheses.
c. Estimate average maximum size when length is 325 mm in a way that conveys information about the precision of estimation.
d. How would the estimate when length is 250 mm compare to the estimate of Part (c)? Answer without actually calculating the new estimate.
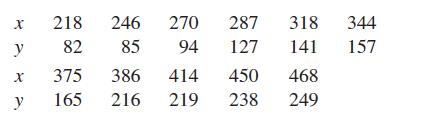
Data from Exercise 5.46
The paper “Feeding of Predaceous Fishes on Out-Migrating Juvenile Salmonids in John Day Reservoir, Columbia River” (Transactions of the American Fisheries Society [1991]: 405–420) gave the following data on y = maximum size of salmonids consumed by a northern squawfish (the most abundant salmonid predator) and x = squawfish length, both in millimeters:
Use the accompanying output from MINITAB to answer the following questions.
Step by Step Answer:
To answer the questions we can use the provided MINITAB output and the data given a Does there appear to be a useful linear relationship between length and size To evaluate the usefulness of a linear ...View the full answer


Introduction To Statistics And Data Analysis
ISBN: 9780495118732
3rd Edition
Authors: Roxy Peck, Chris Olsen, Jay L. Devore
