

In a study of warp breakage during the weaving of fabric (Technometrics [1982]: 63), 100 pieces of
Question:
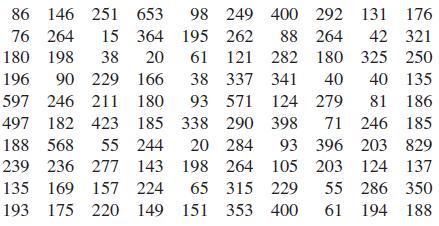
In a study of warp breakage during the weaving of fabric (Technometrics [1982]: 63), 100 pieces of yarn were tested. The number of cycles of strain to breakage was recorded for each yarn sample. The resulting data are given in the following table:
a. Construct a frequency distribution using the class intervals 0 to
b. Draw the histogram corresponding to the frequency distribution in Part (a). How would you describe the shape of this histogram?
c. Find a transformation for these data that results in a more symmetric histogram than what you obtained in Part (b).
Step by Step Answer:

This question has not been answered yet.
You can Ask your question!
Related Book For 

Introduction To Statistics And Data Analysis
ISBN: 9780495118732
3rd Edition
Authors: Roxy Peck, Chris Olsen, Jay L. Devore
Question Posted:
