

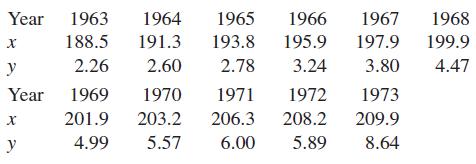
The accompanying data on x = U.S. population (millions) and y = crime index (millions) appeared in
Question:
The accompanying data on x = U.S. population (millions) and y = crime index (millions) appeared in the article “The Normal Distribution of Crime” (Journal of Police Science and Administration [1975]: 312–318). The author comments that “The simple linear regression analysis remains one of the most useful tools for crime prediction.” When observations are made sequentially in time, the residuals or standardized residuals should be plotted in time order (that is, first the one for time t = 1 (1963 here), then the one for time t = 2, and so on). Notice that here x increases with time, so an equivalent plot is of residuals or standardized residuals versus x. Using ŷ = 47.26 + .260x, calculate the residuals and plot the (x, residual) pairs. Does the plot exhibit a pattern that casts doubt on the appropriateness of the simple linear regression model? Explain.
Step by Step Answer:
To determine whether the simple linear regression model is appropriate we need to calculate the residuals and plot the x residual pairs Residuals repr...View the full answer


Introduction To Statistics And Data Analysis
ISBN: 9780495118732
3rd Edition
Authors: Roxy Peck, Chris Olsen, Jay L. Devore
