

The article The Healthy Kids Survey: A Look at the Findings (San Luis Obispo Tribune, October 25,
Question:
The article “The Healthy Kids Survey: A Look at the Findings” (San Luis Obispo Tribune, October 25, 2002) gave the accompanying information for a sample of fifth graders in San Luis Obispo County. Responses are to the question:
“After school, are you home alone without adult supervision?”
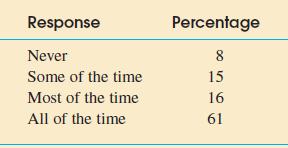
a. Summarize these data using a pie chart.
b. Construct a segmented bar chart for these data.
c. Which graphing method—the pie chart or the segmented bar chart—do you think does a better job of conveying information about response? Explain.
Fantastic news! We've Found the answer you've been seeking!
Step by Step Answer:
a Summarizing the data using a pie chart To create a pie chart we represent each response category as a slice of the pie with the size of the slice co...View the full answer

Answered By
Akash M Rathod
I have been utilized by educators and students alike to provide individualized assistance with everything from grammar and vocabulary to complex problem-solving in various academic subjects. I can provide explanations, examples, and practice exercises tailored to each student's individual needs, helping them to grasp difficult concepts and improve their skills.
My tutoring sessions are interactive and engaging, utilizing a variety of tools and resources to keep learners motivated and focused. Whether a student needs help with homework, test preparation, or simply wants to improve their skills in a particular subject area, I am equipped to provide the support and guidance they need to succeed.
0 Reviews
10+ Question Solved
Related Book For 

Introduction To Statistics And Data Analysis
ISBN: 9780495118732
3rd Edition
Authors: Roxy Peck, Chris Olsen, Jay L. Devore
Question Posted:
