

The Chronicle of Higher Education (January 29, 2003) summarized an article that appeared on the American Prospect
Question:
The Chronicle of Higher Education (January 29, 2003) summarized an article that appeared on the American Prospect web site titled “College Try: Why Universities Should Stop Encouraging Applicants to Take the SATs Over and Over Again.” This paper argued that current college admission policies that permit applicants to take the SAT exam multiple times and then use the highest score for consideration of admission favor students from families with higher incomes (who can afford to take the exam many times). The author proposed two alternatives that he believes would be fairer than using the highest score: (1) Use the average of all test scores, (2) Use only the most recent score.
In this activity, you will investigate the differences between the three possibilities by looking at the sampling distributions of three statistics for a test taker who takes the exam twice and for a test taker who takes the exam five times. The three statistics are
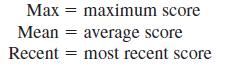
An individual’s score on the SAT exam fluctuates between test administrations. Suppose that a particular student’s “true ability” is reflected by an SAT score of 1200 but, because of chance fluctuations, the test score on any particular administration of the exam can be considered a random variable that has a distribution that is approximately normal with mean 1200 and standard deviation 30. If we select a sample from this normal distribution, the resulting set of observations can be viewed as a collection of test scores that might have been obtained by this student.
Part 1: Begin by considering what happens if this student takes the exam twice. You will use simulation to generate samples of two test scores, Score1 and Score2, for this student. Then you will compute the values of Max, Mean, and Recent for each pair of scores. The resulting values of Max, Mean, and Recent will be used to construct approximations to the sampling distributions of the three statistics.
The instructions that follow assume the use of MINITAB. If you are using a different software package or a graphing calculator, your instructor will provide alternative instructions.
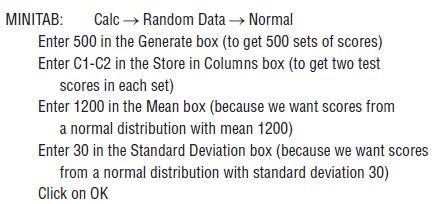
a. Obtain 500 sets of 2 test scores by generating observations from a normal distribution with mean 1200 and standard deviation 30.
b. Looking at the MINITAB worksheet, you should now see 500 rows of values in each of the first two columns. The two values in any particular row can be regarded as the test scores that might be observed when the student takes the test twice. For each pair of test scores, we now calculate the values of Max, Mean, and Recent.
i. Recent is just the last test score, so the values in C2 are the values of Recent. Name this column recent2 by typing the name into the gray box at the top of C2.
ii. Compute the maximum test score (Max) for each pair of scores, and store the values in C3, as follows:
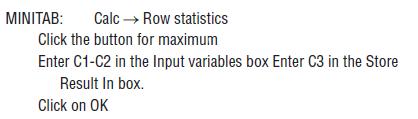
You should now see the maximum value for each pair in C3. Name this column max2.
iii. Compute the average test score (Mean) for each pair of scores, and store the values in C4, as follows:
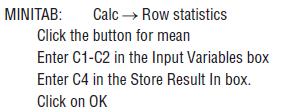
You should now see the average for each pair in C4. Name this column mean2.
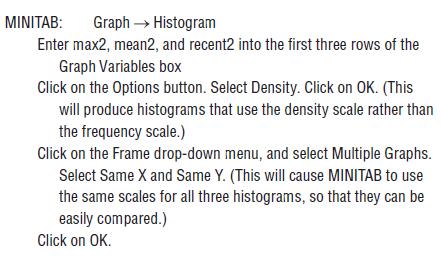
c. Construct density histograms for each of the three statistics (these density histograms approximate the sampling distributions of the three statistics), as follows:
Part 2: Now you will produce approximate sampling distributions for these same three statistics, but for the case of a student who takes the exam five times. Follow the same steps as in Part 1, with the following modifications:
a. Obtain 500 sets of 5 test scores, and store these values in columns C11– C15.
b. Recent will just be the values in C15; name this column recent5. Compute the Max and Mean values, and store them in columns C16 and C17. Name these columns max5 and mean5.
c. Construct density histograms for max5, mean5, and recent5.
Part 3: Now use the approximate sampling distributions constructed in Parts 1 and 2 to answer the following questions.
a. The statistic that is the average of the test scores is just a sample mean (for a sample of size 2 in Part 1 and for a sample of size 5 in Part 2). How do the sampling distributions of mean2 and mean5 compare to what is expected based on the general properties of the distribution given in Section 8.2? Explain.
b. Based on the three distributions from Part 1, for a two time test taker, describe the advantage of using the maximum score compared to using either the average score or the most recent score.
c. Now consider the approximate sampling distributions of the maximum score for two-time and for five-time test takers. How do these two distributions compare?
d. Does a student who takes the exam five times have a big advantage over a student of equal ability who takes the exam only twice if the maximum score is used for college admission decisions? Explain.
e. If you were writing admission procedures for a selective university, would you recommend using the maximum test score, the average test score, or the most recent test score in making admission decisions? Write a paragraph explaining your choice.
Data from Section 8.2
General Properties of the Sampling Distribution of x̅
Let x̅ denote the mean of the observations in a random sample of size n from a population having mean μ and standard deviation σ. Denote the mean value of x̅ the distribution by μx̅ and the standard deviation of x̅ the distribution by σx̅. Then the following rules hold:
Rule 1. μx̅ = μ.
Rule 2. ![]()
This rule is exact if the population is infinite, and is approximately correct if the population is finite and no more than 10% of the population is included in the
sample.
Rule 3. When the population distribution is normal, the sampling distribution of x̅ is also normal for any sample size n.
Rule 4. (Central Limit Theorem) When n is sufficiently large, the sampling distribution of x̅ is well approximated by a normal curve, even when the population distribution is not itself normal.
Step by Step Answer:


Introduction To Statistics And Data Analysis
ISBN: 9780495118732
3rd Edition
Authors: Roxy Peck, Chris Olsen, Jay L. Devore
