

The following scores are the ages for a random sample of n = 32 drivers who were
Question:
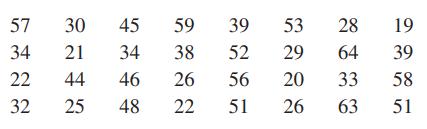
The following scores are the ages for a random sample of n = 32 drivers who were issued parking tickets in Chicago during 2019. Determine the best interval width and place the scores in a grouped frequency distribution table. From looking at your table, does it appear that tickets are issued equally across age groups?
Fantastic news! We've Found the answer you've been seeking!
Step by Step Answer:
A random sample of 32 drivers who were issued parking tickets We have to deter...View the full answer

Answered By
Marvine Ekina
Marvine Ekina
Dedicated and experienced Academic Tutor with a proven track record for helping students to improve their academic performance. Adept at evaluating students and creating learning plans based on their strengths and weaknesses. Bringing forth a devotion to education and helping others to achieve their academic and life goals.
PERSONAL INFORMATION
Address: , ,
Nationality:
Driving License:
Hobbies: reading
SKILLS
????? Problem Solving Skills
????? Predictive Modeling
????? Customer Service Skills
????? Creative Problem Solving Skills
????? Strong Analytical Skills
????? Project Management Skills
????? Multitasking Skills
????? Leadership Skills
????? Curriculum Development
????? Excellent Communication Skills
????? SAT Prep
????? Knowledge of Educational Philosophies
????? Informal and Formal Assessments
0 Reviews
10+ Question Solved
Related Book For 

Essentials Of Statistics For The Behavioral Sciences
ISBN: 9780357365298
10th Edition
Authors: Frederick J Gravetter, Larry B. Wallnau, Lori Ann B. Forzano, James E. Witnauer
Question Posted:
