

This activity presumes that you have already worked through Activity 9.1. In Section 9.2, it was suggested
Question:
This activity presumes that you have already worked through Activity 9.1. In Section 9.2, it was suggested that a confidence interval of the form
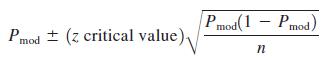
where
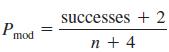
is an alternative to the usual large-sample z confidence interval. This alternative interval is preferred by many statisticians because, in repeated sampling, the proportion of intervals constructed that include the actual value of the population proportion, p, tends to be closer to the stated confidence level. In this activity, we will explore how the “capture rates” for the two different interval estimation methods compare.
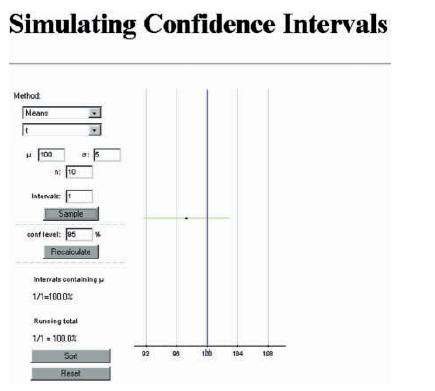
Open the applet (available in Thomson NOW at www.thomsonedu.com/login) called Confidence Intervals. You should see a screen like the one shown.
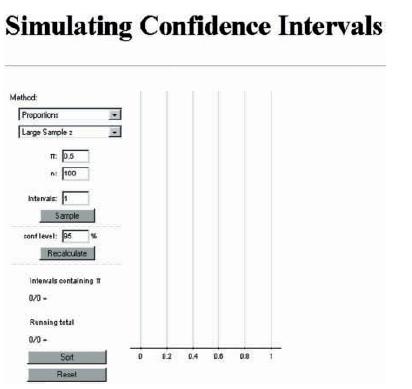
Select “Proportion” from the Method box drop-down menu, and then select “Large Sample z” from the dropdown menu of the second box. We will consider sampling from a population with π = .3 using a sample size of 40. In the applet window, enter π = .3 and n = 40. Note that n = 40 is large enough to satisfy nπ ≥ 10 and n(1 − π) ≥ 10.
Set the “Intervals” box to 100, and then use the applet to construct a large number (at least 1000) of 95% confidence intervals.
1. How does the proportion of intervals constructed that include π = .3, the population proportion, compare to 95%? Does this surprise you? Explain. Now use the drop-down menu to change “Large Sample z” to “Modified.” Now the applet will construct the alternative confidence interval that is based on Pmod. Use the applet to construct a large number (at least 1000) of 95% confidence intervals.
2. How does the proportion of intervals constructed that include π = .3, the population proportion, compare to 95%? Is this proportion closer to 95% than was the case for the large-sample z interval?
3. Experiment with different combinations of values of sample size and population proportion π. Can you find a combination for which the large sample z interval has a capture rate that is close to 95%? Can you find a combination for which it has a capture rate that is even farther from 95% than it was for n = 40 and π = .3? How does the modified interval perform in each of these cases?
Data from Activity 9.1
Technology Activity (Applet): Open the applet (available in Thomson NOW at www.thomsonedu.com/login) called Confidence Intervals. You should see a screen like the one shown.
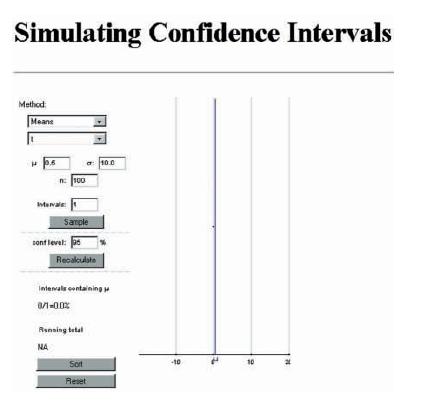
Getting Started: If the “Method” box does not say “Means,” use the drop-down menu to select Means. In the box just below, select “t” from the drop-down menu. This applet will select a random sample from a specified normal population distribution and then use the sample to construct a confidence interval for the population mean. The interval is then plotted on the display at the right, and we can see if the resulting interval contains the actual value of the population mean.
For purposes of this activity, we will sample from a normal population with mean 100 and standard deviation 5. We will begin with a sample size of n = 10. In the applet window, set μ = 100, σ = 5 and n = 10. Leave the conf-level box set at 95%. Click the “Recalculate” button to rescale the picture on the right. Now click on the sample button. You should see a confidence interval appear on the display on the right hand side. If the interval contains the actual mean of 100, the interval is drawn in green; if 100 is not in the confidence interval, the interval is shown in red. Your screen should look something like the following.
Part 1: Click on the “Sample” button several more times, and notice how the confidence interval estimate changes from sample to sample. Also notice that at the bottom of the left-hand side of the display, the applet is keeping track of the proportion of all the intervals calculated so far that include the actual value of μ. If we were to construct a large number of intervals, this proportion should closely approximate the capture rate for the confidence interval method.
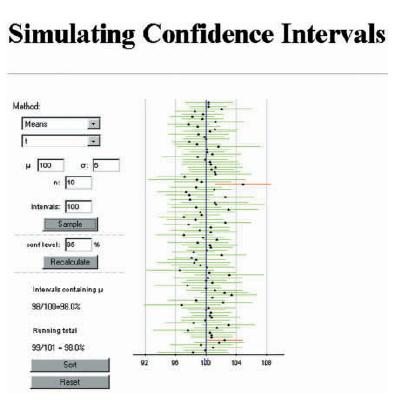
To look at more than 1 interval at a time, change the “Intervals” box from 1 to 100, and then click the sample button. You should see a screen similar to the one at the top of page 515, with 100 intervals is the display on the right-hand side. Again, intervals containing 100 (the value of μ in this case) will be green and those that do not contain 100 will be red. Also note that the capture proportion on the left-hand side has also been updated to reflect what happened with the 100 newly generated intervals.
Continue generating intervals until you have seen at least 1000 intervals, and then answer the following question:
a. How does the proportion of intervals constructed that contain μ = 100 compare to the stated confidence level of 95%? On how many intervals was your proportion based?
Experiment with three other confidence levels of your choice, and then answer the following question:
b. In general, is the proportion of computed t confidence intervals that contain μ = 100 close to the stated confidence level?
Part 2: When the population is normal but σ is unknown, we construct a confidence interval for a population mean using a t critical value rather than a z critical value. How important is this distinction?
Let’s investigate. Use the drop-down menu to change the box just below the method box that’s says “Means” from “t” to “z with s.” The applet will now construct intervals using the sample standard deviation, but will use a z critical value rather than the t critical value.
Use the applet to construct at least 1000 95% intervals, and then answer the following question:
c. Comment on how the proportion of the computed intervals that include the actual value of the population mean compares to the stated confidence level of 95%. Is this surprising? Explain why or why not.
Now experiment with some different samples sizes. What happens when n = 20? n = 50? n = 100? Use what you have learned to write a paragraph explaining what these simulations tell you about the advisability of using a z critical value in the construction of a confidence interval for μ when σ is unknown.
Step by Step Answer:


Introduction To Statistics And Data Analysis
ISBN: 9780495118732
3rd Edition
Authors: Roxy Peck, Chris Olsen, Jay L. Devore
