Question:
Consider the data set for Exercise 7.58, page 341 (hospital data), repeated here.
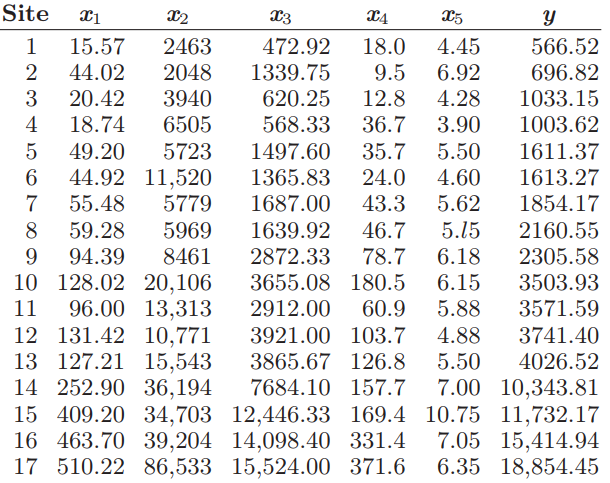
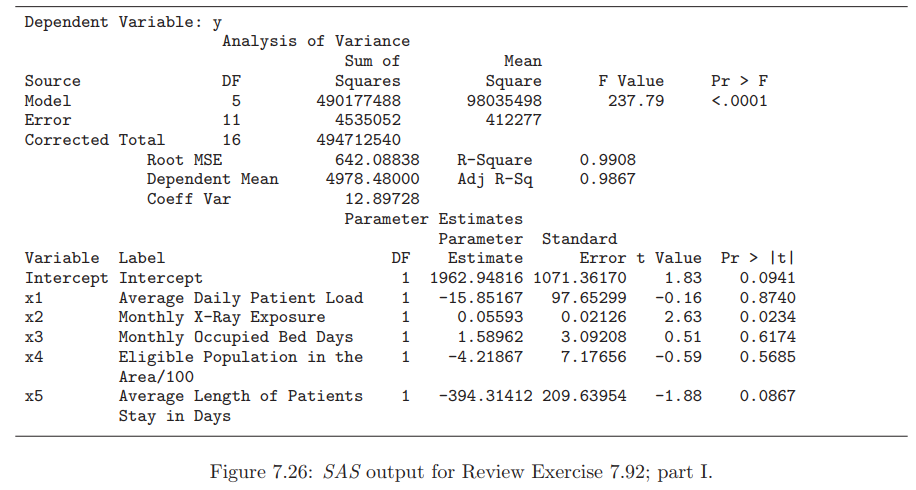
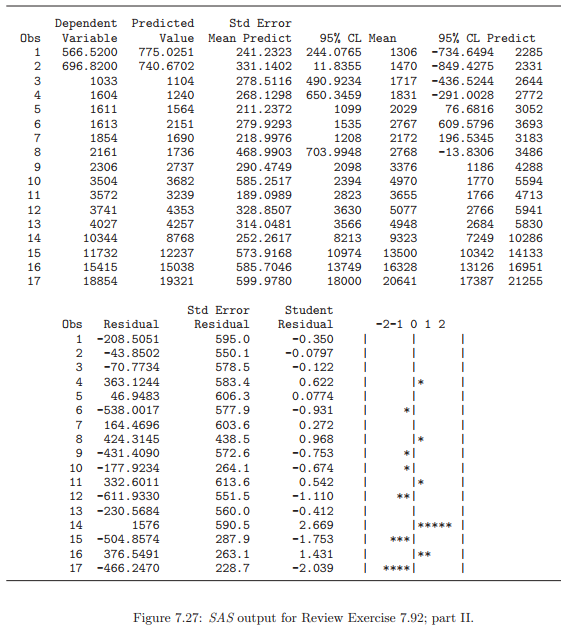
(a) The SAS PROC REG outputs provided in Figures 7.26 and 7.27 on pages 353 and 354 supply a considerable amount of information. Goals are to do outlier detection and eventually determine which model terms are to be used in the final model.(b) Often the role of a single regression variable is not apparent when it is studied in the presence of several other variables. This is due to multicollinearity. With this in mind, comment on the importance of x2 and x3 in the full model as opposed to their importance in a model in which they are the only variables.(c) Comment on what other analyses should be run.(d) Run appropriate analyses and write your conclusions concerning the final model.
Transcribed Image Text:
Site x2 з L4 X5 15.57 44.02 4.45 6.92 2463 472.92 18.0 566.52 2048 1339.75 9.5 696.82 1033.15 20.42 3 3940 620.25 12.8 4.28 3.90 5.50 4 18.74 6505 568.33 36.7 1003.62 1611.37 5 49.20 5723 1497.60 35.7 44.92 11,520 55.48 59.28 94.39 6 1365.83 24.0 4.60 1613.27 5.62 5.15 6.18 5779 1687.00 43.3 1854.17 5969 46.7 1639.92 2160.55 8461 2872.33 78.7 2305.58 10 128.02 20,106 96.00 13,313 12 131.42 10,771 13 127.21 15,543 14 252.90 36,194 15 409.20 34,703 12,446.33 169.4 10.75 11,732.17 16 463.70 39,204 14,098.40 331.4 17 510.22 86,533 15,524.00 371.6 6.15 5.88 3503.93 3571.59 3655.08 180.5 11 2912.00 60.9 4.88 5.50 3921.00 103.7 3741.40 3865.67 126.8 4026.52 7.00 10,343.81 7684.10 157.7 7.05 15,414.94 6.35 18,854.45 Dependent Variable: y Analysis of Variance Sum of Mean Source DF Squares Square F Value Pr > F Model 490177488 98035498 237.79 <.0001 11 16 Error 4535052 412277 Corrected Total 494712540 Root MSE 642.08838 R-Square Adj R-Sq 0.9908 Dependent Mean 4978.48000 0.9867 Coeff Var 12.89728 Parameter Estimates Parameter Standard DF Error t Value Pr > |t| 1.83 Variable Label Estimate Intercept Intercept 1 1962.94816 1071.36170 0.0941 Average Daily Patient Load Monthly X-Ray Exposure Monthly Occupied Bed Days Eligible Population in the Area/100 Average Length of Patients Stay in Days х1 -15.85167 97.65299 -0.16 0.8740 х2 0.05593 0.02126 2.63 0.0234 х3 1.58962 3.09208 0.51 0.6174 x4 -4.21867 7.17656 -0.59 0.5685 x5 -394.31412 209.63954 -1.88 0.0867 Figure 7.26: SAS output for Review Exercise 7.92; part I.