

Create a histogram for these three sets of scores. Each set of scores represents a sample taken
Question:
a. 6 4 11 7 7
b. 6 4 11 7 7 2 10 7 8 6 6 7 5 8
c.
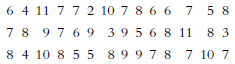
d. What do you observe happening across these three distributions?
Fantastic news! We've Found the answer you've been seeking!
Step by Step Answer:
a b c d As the sample size ...View the full answer

Answered By
Efthymios Kolyvas
I have been teaching Physics and Mathematics since 2005. I have a M.Sc. in Renewable energies, I have published a book for higher level physics students last year. I have also been teaching S.T.E.M. robotics, combining the basic principles of physics, mechanics and programming. When teaching I focus on every student, because each individual is unique and has his own needs and advantages. No two students are the same. With patience and persistence, we can achieve our highest expectations. Dream big, everything is possible. Work smart not hard.
0 Reviews
10+ Question Solved
Related Book For 

Essentials Of Statistics For The Behavioral Sciences
ISBN: 9781464107771
3rd Edition
Authors: Susan A. Nolan
Question Posted:
