

Use the magnitudes (Richter scale) of the earthquakes listed in Data Set 16 in Appendix B. In
Question:
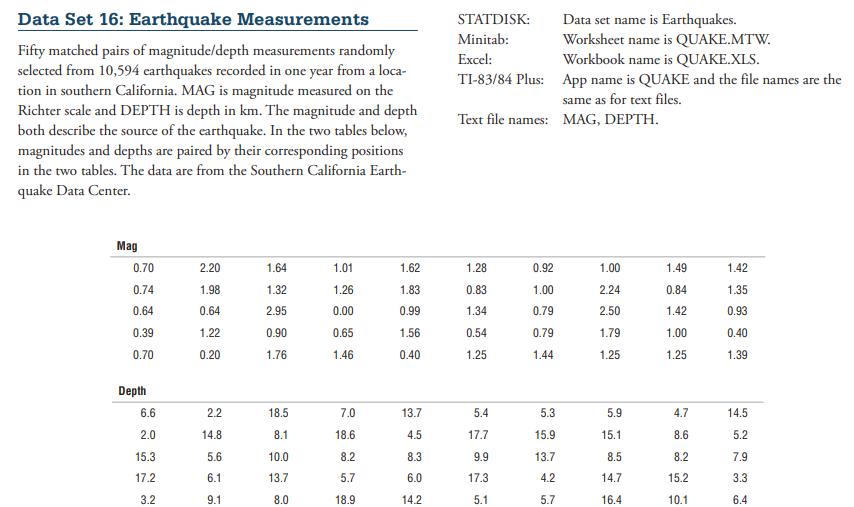
Use the magnitudes (Richter scale) of the earthquakes listed in Data Set 16 in Appendix B. In 1989, the San Francisco Bay Area was struck with an earthquake that measured 7.0 on the Richter scale. That earthquake occurred during the warm-up period for the third game of the baseball World Series. Is the magnitude of that World Series earthquake an outlier (data value that is very far away from the others) when considered in the context of the sample data given in Data Set 16? Explain.
Fantastic news! We've Found the answer you've been seeking!
Step by Step Answer:

Answered By
Branice Buyengo Ajevi
I have been teaching for the last 5 years which has strengthened my interaction with students of different level.
1+ Reviews
10+ Question Solved
Related Book For 
Question Posted:
