

Use the sample data from Exercise 6 with a 0.01 significance level to test the claim that
Question:
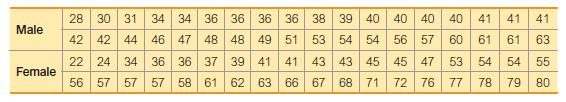
Use the sample data from Exercise 6 with a 0.01 significance level to test the claim that males and females have the same mean.
Data from in Exercise 6
Listed below are sorted braking reaction times (in 1>10,000 sec) for male and female subjects (based on data from the RT-2S Brake Reaction Time Tester). Construct a histogram for the reaction times of males. Use a class width of 8 and use 28 as the lower limit of the first class. For the horizontal axis, use class midpoint values. Does it appear that the data are from a population with a normal distribution?
Fantastic news! We've Found the answer you've been seeking!
Step by Step Answer:
Here is a histogram for the reaction times of male subjects ba...View the full answer

Answered By
NARESH KUMAR
So the question became, how do I keep tutoring and help more people, a.k.a., clone myself. I got my answer teaching a team in Bangalore, India about pension plans. I built Excel spreadsheets with formulas. But, I added one twist…next to the number cells, I added comments with step-by-step math to explain actuarial formulas and life expectancies.
The team in Bangalore loved it, it cut their learning curve down significantly. So the lightbulb went on…why can’t I build a program/website to tutor in math. Essentially, can’t I put my brain on a website. This way, people can use the calculators without me having to be there.
0 Reviews
10+ Question Solved
Related Book For 
Question Posted:
