

The following table contains financial statement information for The Procter & Gamble Company ($ millions) for the
Question:
The following table contains financial statement information for The Procter & Gamble Company ($ millions) for the fiscal years ended in June of each year: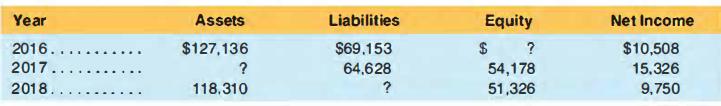
REQUIRED
a. Compute the missing amounts for assets, liabilities, and equity for each year.
b. Compute return on equity for 2017 and 2018. Let's assume that the median ROE for Fortune 500 companies is about 15%. How does P&G compare with this median?
c. Compute the debt-to-equity ratio for 2017 and 2018. Let's assume that the median debt-to equity ratio for the Fortune 500 companies is 1.8. How does P&G compare to this median?
Fantastic news! We've Found the answer you've been seeking!
Step by Step Answer:
a b 2017 ROE 15326 57983541782 273 2018 ROE 9750 51326541782 185 PGs ROE decreased in 2018 howev...View the full answer

Answered By
Pratik Naik
I HAVE A DEGREE IN ZOOLOGY HONOURS,I HOLD A DIPLOMA IN PHARMACY CERTIFICATE AND A BACHELOR IN EDUCATION DEGREE.I HAVE ALSO DEVELOPED A GREAT COMMUNICATION SKILL WITH STUDENTS AS I HAVE 3 YEARS OF TUTORING EXPERIENCE WHICH GIVES A GREAT ABILITY TO EASILY UNDERSTAND THE NEED OF A STUDENT AND HELP ACCORDINGLY.I AM IN TEACHING PROFESSION TO MAKE A DIFFERENCE IN STUDENTS LIFE AND HELP THEM REALISE THEIR POTENTIAL AND GROW.IT GIVES ME IMMENSE PLEASURE TO TEACH AND GIVE BACK WHAT I HAVE LEARNED IN ALL THOSE YEARS.
0 Reviews
10+ Question Solved
Related Book For 
Financial Accounting
ISBN: 9781618533111
6th Edition
Authors: Michelle L. Hanlon, Robert P. Magee, Glenn M. Pfeiffer, Thomas R. Dyckman
Question Posted:
