

The table shows experimental values of the variables x and y. The variables are known to be
Question:
The table shows experimental values of the variables x and y.
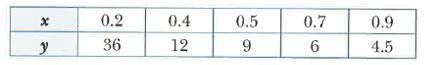
The variables are known to be related by the equation y = a/x+b, where a and b are constants.
a. Draw the graph of lg y against xy.
b. Use your graph to estimate the value of a and the value of b.
An alternate method for obtaining a straight-line graph for the equation y = a/x+b is to plot x on the vertical axis and 1/y on the horizontal axis.
c. Without drawing a second graph, estimate the gradient and the intercept on the vertical axis of this graph.
Fantastic news! We've Found the answer you've been seeking!
Step by Step Answer:
a Draw the graph of lg y against xy To draw the graph of lg y against xywe can first calculate the values of lg y and xy for each data point in the ta...View the full answer

Answered By
Patrick Busaka
I am a result oriented and motivated person with passion for challenges because they provide me an opportunity to grow professionally.
38+ Reviews
58+ Question Solved
Related Book For 

Cambridge IGCSE And O Level Additional Mathematics Coursebook
ISBN: 9781108411660
2nd Edition
Authors: Sue Pemberton
Question Posted:
