

The Metro 2018 income statement follows. Use the preceding income statement and the balance sheet from S12-6
Question:
The Metro 2018 income statement follows.
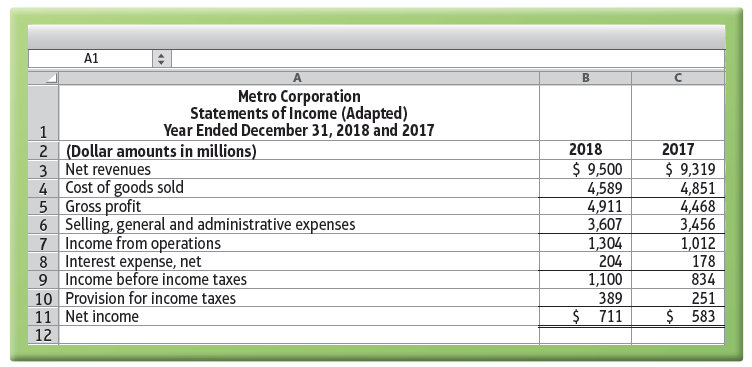
Use the preceding income statement and the balance sheet from S12-6 to calculate the following:
a. Metro’s rate of inventory turnover and days’ inventory outstanding for 2018.
b. Days’ sales in average receivables (days’ sales outstanding) during 2018 (round dollar amounts to one decimal place). Assume all sales are made on account.
c. Accounts payable turnover and days’ payables outstanding for 2018. For this purpose, assume that the impact of inventories on cost of goods sold is immaterial, allowing you to use cost of goods sold rather than purchases in your computations.
d. Length of cash conversion cycle in days for 2018.
Do these measures look strong or weak? Give the reason for your answer.
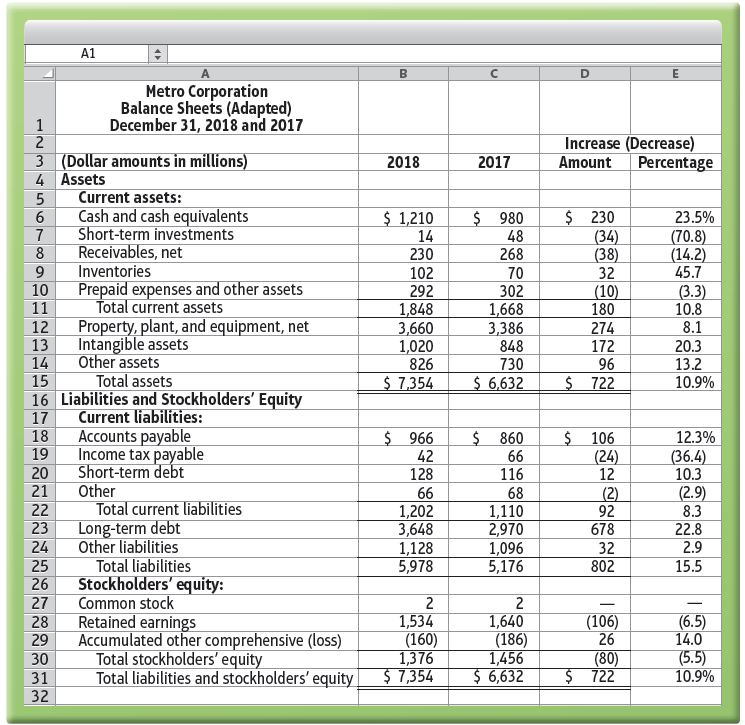
Data from S12-6
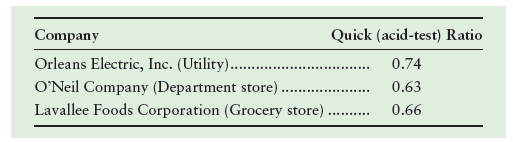
To follow are the balance sheets for Metro Corporation and selected comparative competitor data.
Cash conversion cycle measures the total time a business takes to convert its cash on hand to produce, pay its suppliers, sell to its customers and collect cash from its customers. The process starts with purchasing of raw materials from suppliers,...
Step by Step Answer:
a b Days sales outstanding DSO c Days payables outstanding d Cash conversion cycle in days Cash conv...View the full answer


Financial Accounting
ISBN: 978-0134725987
12th edition
Authors: C. William Thomas, Wendy M. Tietz, Walter T. Harrison Jr.
