

Use the consolidated financial statements and the data in Apple Inc.s annual report in Appendix A and
Question:
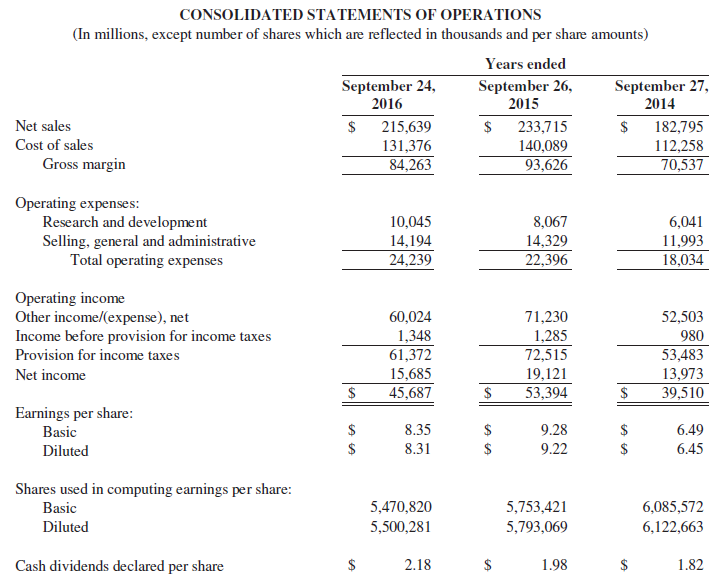
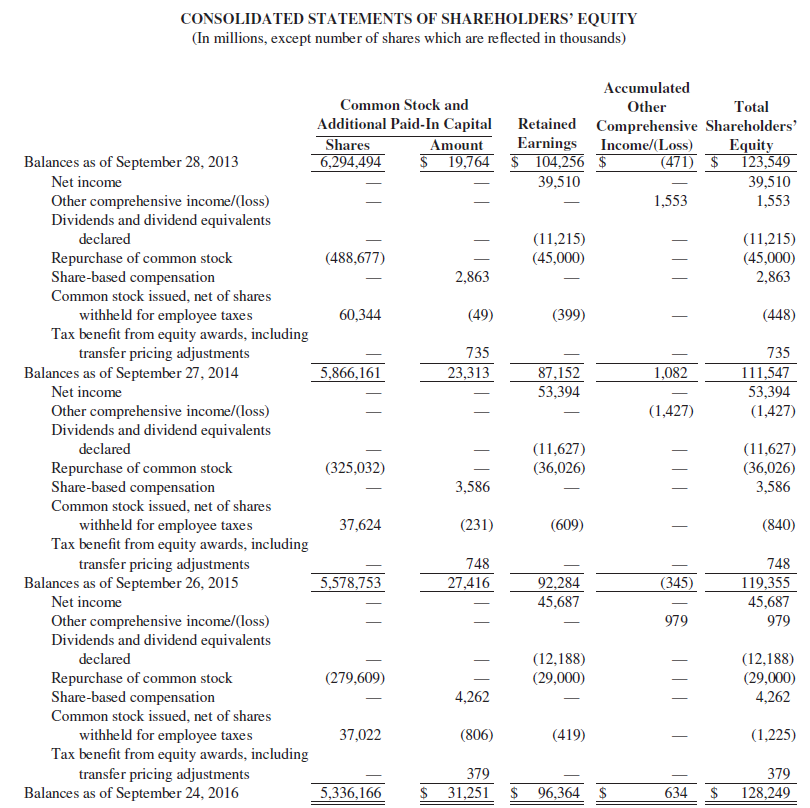
Use the consolidated financial statements and the data in Apple Inc.’s annual report in Appendix A and online in the filings section of www.sec.gov to evaluate the company’s comparative performance for 2016 versus 2015.
Requirements
1. Perform a horizontal and a vertical analysis of the following information on the company’s comparative income statements for 2016 and 2015:
a. Net sales
b. Gross margin
c. Operating income
d. Net income
Did the company appear to be performing better or worse on these dimensions in 2016, relative to 2015? Explain.
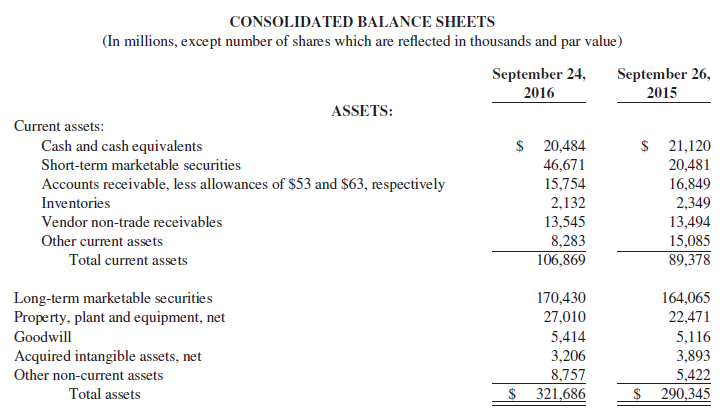
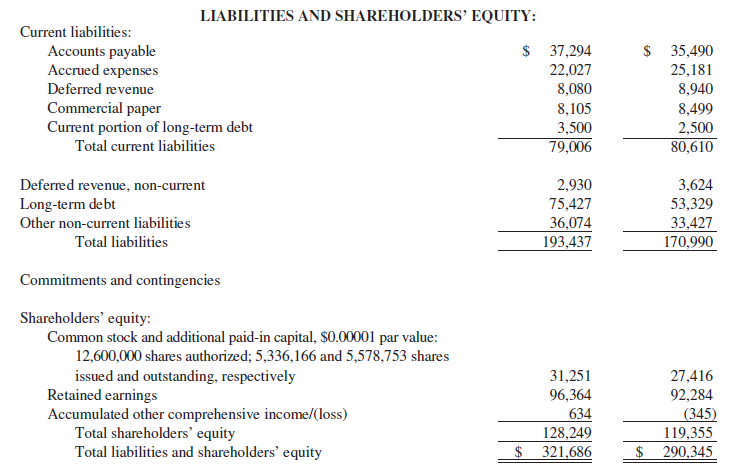
2. Perform horizontal and vertical analysis of the company’s balance sheets for 2016 and 2015. In what areas did the company’s balance sheet appear to be improving? Deteriorating? Explain.
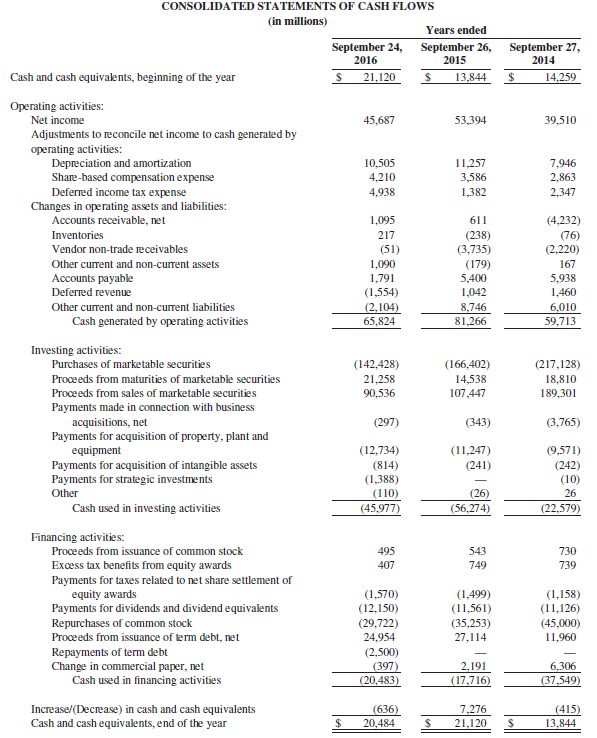
3. Calculate the trends in the major elements of the company’s cash flow statement (operations, investing, and financing) for 2016 relative to 2015. From where does the company generate most of its cash? What did the company spend most of its cash on?
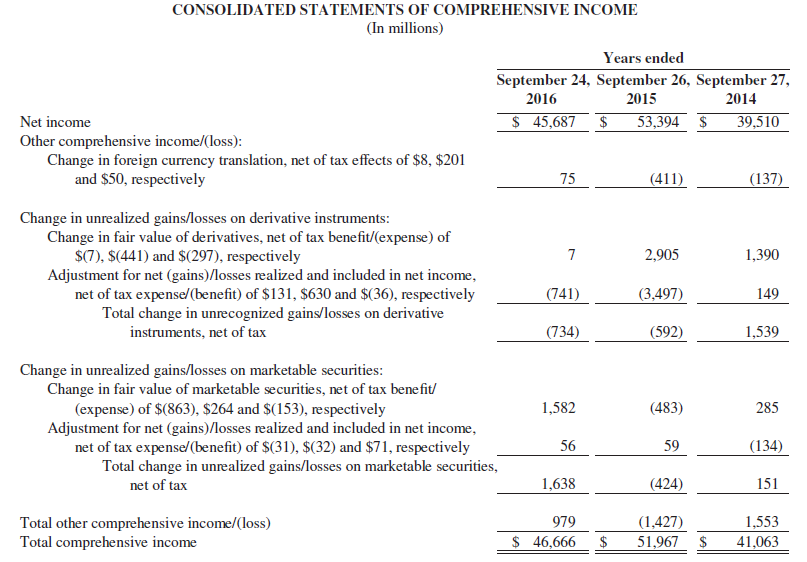
4. Describe the information in Apple’s annual report that can be used to analyze the company’s earnings quality. What is your overall evaluation of Apple’s earnings quality?
Data from Apple Inc.'s
Financial statements are the standardized formats to present the financial information related to a business or an organization for its users. Financial statements contain the historical information as well as current period’s financial... Balance Sheet
Balance sheet is a statement of the financial position of a business that list all the assets, liabilities, and owner’s equity and shareholder’s equity at a particular point of time. A balance sheet is also called as a “statement of financial...
Step by Step Answer:
Req 1 in millions 2016 2015 2016 Vertical Analysis 2015 Vertical Analysis Dollar Change Horizontal Analysis 2016 Amount 2015 Amount Dollar Change Net Sales Net Sales 2015 Amount Net Sales 215639 23371...View the full answer


Financial Accounting
ISBN: 978-0134725987
12th edition
Authors: C. William Thomas, Wendy M. Tietz, Walter T. Harrison Jr.
