

Draw a graph similar to the one shown in exhibit 9.4 and explain its implications. Data from
Question:
Draw a graph similar to the one shown in exhibit 9.4 and explain its implications.
Data from Exhibit 9.4
Ann Arbor Health Care: Corporate and Project Costs of Capital
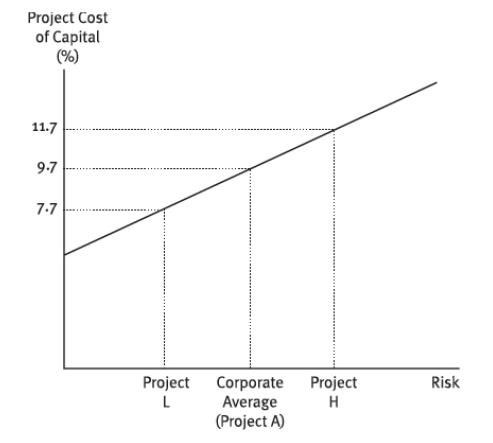
The key point here is that the CCC is merely a benchmark that will be used as the basis for estimating project costs of capital. It is not a one-size-fitsall rate that can be used with abandon whenever an opportunity cost is needed in a financial analysis. This point is revisited in chapter 12, when capital investment risk considerations are addressed.
Step by Step Answer:

This question has not been answered yet.
You can Ask your question!
Related Book For 
Gapenskis Understanding Healthcare Financial Management
ISBN: 9781640551091
8th Edition
Authors: George H. Pink, Paula H. Song
Question Posted:
