

What happens to the SML graph in Figure 2-9 when inflation increases or decreases? Figure 2-9 Required
Question:
What happens to the SML graph in Figure 2-9 when inflation increases or decreases?
Figure 2-9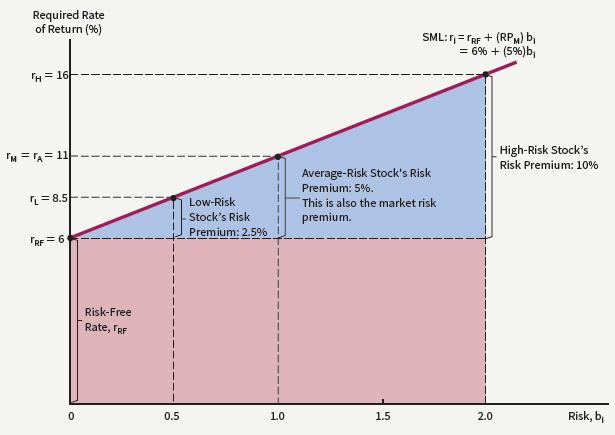
Step by Step Answer:

This question has not been answered yet.
You can Ask your question!
Related Book For 

Intermediate Financial Management
ISBN: 9781337395083
13th Edition
Authors: Eugene F. Brigham, Phillip R. Daves
Question Posted:
