

Financial markets are characterized by volatility, which is linked to the standard deviation of returns. One interesting
Question:
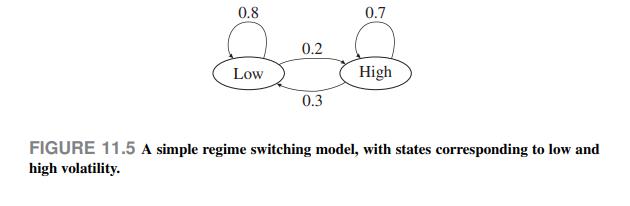
Financial markets are characterized by volatility, which is linked to the standard deviation of returns. One interesting feature of volatility is that we observe periods of relative calm, in which volatility is reasonable, followed by periods of nervousness, where volatility is quite large. Imagine that we want to build a model in which markets can be in one of two states, low and high; the time bucket that we consider is a single trading day. High volatility tends to persist; hence, we cannot just assign a probability that, on one day, markets will be in one of the two states. We may build a regime-switching model, accounting for the fact that each state tends to persist: After a day of high volatility, we are more likely to observe another day of high volatility; the same holds for a day with low volatility. A naive regime-switching model is illustrated in Fig. 11.5. Here we assume that if the last day was in the low state, the next day will feature the same level of volatil-
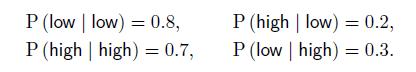
ity with probability 0.8 . However, there is a probability 0.2 that we will observe a day with high volatility. If we get to the high state one day, the next day will feature high volatility again with probability 0.7 , whereas we have a 0.3 probability of moving back to the low state. Clearly, this is an overly naive model, and we are not considering estimation issues arising when a state is hidden, i.e., not directly observable. Formally, we have the following transition probabilities:
A natural question is: If we are currently in a state, what is the expected number of time buckets that we will spend in that state? In other words, what is the expected sojourn time? The answer can be found by using the geometric distribution. We recall that the geometric distribution is the discrete counterpart of the exponential distribution, in terms of a memoryless property. The expected value of a geometric random variable with "failure" probability  is
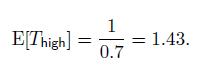
is , where we count the number of trials to obtain the first success, which in this case corresponds to a transition out of the current state. Hence, the expected sojourn time in the high state is
In continuous-time Markov chains, the sojourn time in each state is exponentially distributed.
Data From Fig. 11.5
Step by Step Answer:


An Introduction To Financial Markets A Quantitative Approach
ISBN: 9781118014776
1st Edition
Authors: Paolo Brandimarte
