

The annual return of a risky financial portfolio, denoted by (R_{p}), can be described by the following
Question:
The annual return of a risky financial portfolio, denoted by \(R_{p}\), can be described by the following linear regression model:
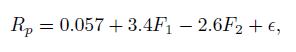
where \(F_{1}\) and \(F_{2}\) are mutually correlated risk factors and ϵ is another risk factor, which is independent from the other two. All risk factors are assumed normally distributed with expected value zero. The standard deviations of \(F_{1}\) and \(F_{2}\) are 0.1 and 0.12 , respectively, and their correlation coefficient is 0.48 ; the standard deviation of the third risk factor is 0.2 .
- Assume that the annual risk-free return is \(r_{f}=2.5 \%\) (annual compounding). What is the probability that the risky portfolio outperforms the risk free investment?
- Assume that you have invested \(€ 1,000,000\) in the risky portfolio. Find the annual V@R at \(95 \%\) confidence level.
Step by Step Answer:
Absolutely lets find the probability of the risky portfolio outperforming the riskfree investment Given Information Riskfree return rf 25 Portfolio re...View the full answer


An Introduction To Financial Markets A Quantitative Approach
ISBN: 9781118014776
1st Edition
Authors: Paolo Brandimarte
