

Historical percentage stock returns for the Robinson and Boyer Companies are listed in the following chart along
Question:
Historical percentage stock returns for the Robinson and Boyer Companies are listed in the following chart along with percentage returns on the market portfolio: Calculate the following based on the preceding table: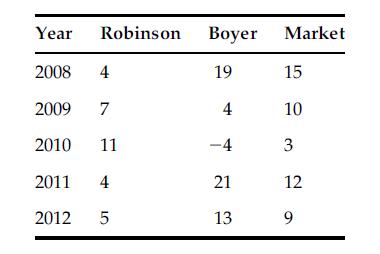
a. Mean historical returns for the two companies and the market portfolio.
b. Variances associated with Robinson Company returns and Boyer Company returns as well as returns on the market portfolio.
c. Forecast a variance and a standard deviation of returns for both the Robinson and Boyer Companies based on your calculations in parts a and b.
Fantastic news! We've Found the answer you've been seeking!
Step by Step Answer:
a R R 50062 R B 50106 R M 0098 b 2 R 0000696 Population 000087 Samplediv...View the full answer

Answered By
Vikash Gupta
I am graduated in Physics in 2018, from KIRORIMAL COLLEGE, University of Delhi. Now I am persuing Master's degree in physics. I like to do physics problems. I have experience of 1 year in tutoring. I think Physics is the only subject where you understand things,how they are happening . In physics you learn Maths and apply it. So I would like to join your platform to solve many Physics problems.
5+ Reviews
10+ Question Solved
Related Book For 

Question Posted:
