

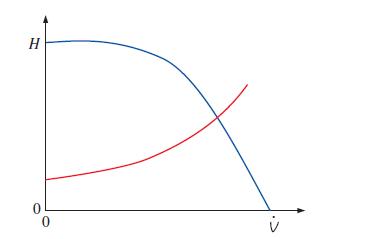
In Fig. P1419C is shown a plot of pump net head as a function of pump volume
Question:
In Fig. P14–19C is shown a plot of pump net head as a function of pump volume flow rate, or capacity. On the figure, label the shutoff head, the free delivery, the pump performance curve, the system curve, and the operating point.
FIGURE P14–19C
Step by Step Answer:

This question has not been answered yet.
You can Ask your question!
Related Book For 
Fluid Mechanics Fundamentals And Applications
ISBN: 9780073380322
3rd Edition
Authors: Yunus Cengel, John Cimbala
Question Posted:
