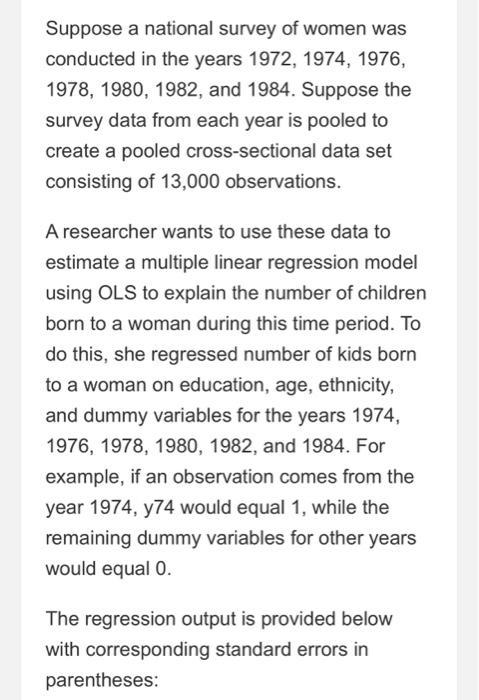
Suppose a national survey of women was conducted in the years 1972, 1974, 1976, 1978, 1980,...
Fantastic news! We've Found the answer you've been seeking!
Question:
Transcribed Image Text:
Suppose a national survey of women was conducted in the years 1972, 1974, 1976, 1978, 1980, 1982, and 1984. Suppose the survey data from each year is pooled to create a pooled cross-sectional data set consisting of 13,000 observations. A researcher wants to use these data to estimate a multiple linear regression model using OLS to explain the number of children born to a woman during this time period. To do this, she regressed number of kids born to a woman on education, age, ethnicity, and dummy variables for the years 1974, 1976, 1978, 1980, 1982, and 1984. For example, if an observation comes from the year 1974, y74 would equal 1, while the remaining dummy variables for other years would equal 0. The regression output is provided below with corresponding standard errors in parentheses: Given the below critical values fill in the blanks. Round to two decimals if necessary. Significance level Critical value 1% 5% 10% 2.58 1.96 1.64 kids= 7.731 +0.22y74-0.07y76-0.12y78-0.18y80-0.42y82-0.65y84 -0.135educ (3.101) (0.071) (0.171) (0.182) (0.088) (0.175) (0.173) (0.20) +0.277age-0.0055age2 +0.88black (0.177) R²=0.44 (0.111) (0.001) The coefficient of y74 is . This implies, holding education, age and race constant, 100 women in 1974 are predicted to have children compared to 100 women in 1972. (Hint: For the second blank of this sentence make a choice between "more" and "fewer".) t-value of y74 is equal to . So, the difference between number of children born to a woman in 1974 compared to a woman having the same characteristics in the base year statistically significant at 1% significance level. Suppose a national survey of women was conducted in the years 1972, 1974, 1976, 1978, 1980, 1982, and 1984. Suppose the survey data from each year is pooled to create a pooled cross-sectional data set consisting of 13,000 observations. A researcher wants to use these data to estimate a multiple linear regression model using OLS to explain the number of children born to a woman during this time period. To do this, she regressed number of kids born to a woman on education, age, ethnicity, and dummy variables for the years 1974, 1976, 1978, 1980, 1982, and 1984. For example, if an observation comes from the year 1974, y74 would equal 1, while the remaining dummy variables for other years would equal 0. The regression output is provided below with corresponding standard errors in parentheses: Given the below critical values fill in the blanks. Round to two decimals if necessary. Significance level Critical value 1% 5% 10% 2.58 1.96 1.64 kids= 7.731 +0.22y74-0.07y76-0.12y78-0.18y80-0.42y82-0.65y84 -0.135educ (3.101) (0.071) (0.171) (0.182) (0.088) (0.175) (0.173) (0.20) +0.277age-0.0055age2 +0.88black (0.177) R²=0.44 (0.111) (0.001) The coefficient of y74 is . This implies, holding education, age and race constant, 100 women in 1974 are predicted to have children compared to 100 women in 1972. (Hint: For the second blank of this sentence make a choice between "more" and "fewer".) t-value of y74 is equal to . So, the difference between number of children born to a woman in 1974 compared to a woman having the same characteristics in the base year statistically significant at 1% significance level.
Expert Answer:
Related Book For
Data Analysis and Decision Making
ISBN: 978-0538476126
4th edition
Authors: Christian Albright, Wayne Winston, Christopher Zappe
Posted Date:
Students also viewed these economics questions
-
An article in Cancer Epidemiology, Biomarkers and Prevention (1996, Vol. 5, pp. 849852) reported on a pilot study to assess the use of toenail arsenic concentrations as an indicator of ingestion of...
-
An article in Cancer Epidemiology, Biomarkers and Prevention (1996, Vol. 5, pp. 849852) reported on a pilot study to assess the use of toenail arsenic concentrations as an indicator of ingestion of...
-
Each year drinking and driving behavior are estimated to be responsible for approximately 24,000 traffic fatalities in the United States. Data show that a preponderance of this problem is due to the...
-
Use lHpitals rule to find the limit. 31 + 3 43 14t - t + 3 lim
-
Show how you could prepare the following amino acids using a reductive amination: (a) Methionine (b) Isoleucine
-
Describe the calculation of the inertia influence coefficient \(m_{12}\). The generalized coordinates for modeling a system have been selected as \(x_{1}, x_{2}\), and \(\theta\) where \(x_{1}\) and...
-
Orbit Airways purchased a baggage-handling truck for $41,000. Suppose Orbit Airways sold the truck on December 31,2010, for $28,000 cash, after using the truck for two full years and accumulating...
-
Jane Melody asks you to scan Sonics external environment for early warning signals of new opportunities and emerging threats that could affect the success of the Sonic 1000 Smartphone. Using Internet...
-
Mrs JD wants to pay for her daughter's university education. She will deposit R5 000 at the beginning of every six months for the next 10 years in an investment product with Quantum Bank. The...
-
Pecos Company acquired 100 percent of Suaro's outstanding stock for $1,450,000 cash on 1/1/2014, when Suaro had the following balance sheet: Cash - $37,000 Liabilities - ($422,000) Receivables -...
-
9. Compute the electrical change on a bit x (x,y) x (x, y) q (0,0) -8 (0,)
-
Question: What are the components of aggregate demand in a country's economy, and how do changes in these components impact overall economic output?
-
In cosmology, the Hubble time is the time for us to receive the light of a galaxy that is just about close to move away from us at the speed of light. Currently this is estimated to have a value of...
-
How would you improve the master baker's productivity? How will you improve the bread factory's productivity?
-
Rafner Manufacturing has the following budgeted data for its two production departments. Budgeted Data Assembly Overhead cost $ 1,485,900 Direct labor hours Machine hours 12,700 direct labor hours...
-
If someone had bought 2,120 shares at the end of Year 2 and sold these shares at the end of Year 4, how much net profit they have made as a result of their share ownership? Show all work step by step.
-
Construct a line chart to examine the "Total Population" growth (row 35 of the worksheet) for the years 2000-2009. Format the chart with the title "Total Utah Population" and a legend to the right of...
-
A superior criticized a sales manager for selling high-revenue, low-profit items instead of lower-revenue but higher-profit items. The sales manager responded, My income is based on commissions that...
-
Using the graphical solution of the product mix model as a guide, suppose there are only 2800 testing hours available. How do the answers to the previous problem change?
-
The game of Chuck-a-Luck is played as follows: You pick a number between 1 and 6 and toss three dice. If your number does not appear, you lose $1. If your number appears x times, you win $x. On the...
-
A high roller comes to the casino intending to play 500 hands of blackjack for $1 a hand. On each hand, the high roller will win $1 with probability 0.48 and lose $1 with probability 0.52. After the...
-
Solve Problem 14 for \(k=40 \mathrm{lb} /\) in and \(W=20 \mathrm{lb}\). 14. For a mass-spring-damper system under harmonic loading per unit mass F(t)/mcos ut ft/s, solve wt for the response...
-
Solve Problem 14 for \(k=20 \mathrm{lb} /\) in and \(W=20 \mathrm{lb}\). 14. For a mass-spring-damper system under harmonic loading per unit mass F(t)/mcos ut ft/s, solve wt for the response...
-
For Problem 14 where \(k=20 \mathrm{lb} /\) in and \(W=40 \mathrm{lb}\), solve for the steady-state responses in \(\mathrm{ft} / \mathrm{s}^{2}\) to the following excitation forces per unit mass: (a)...
Study smarter with the SolutionInn App