

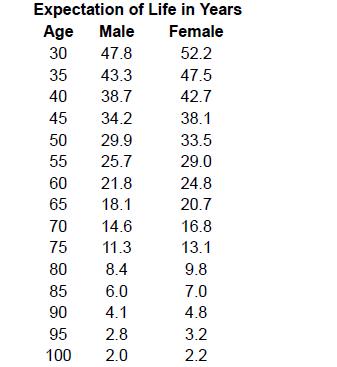
Using Exhibit 12-2, determine the average number of additional years males alive at age 35 may expect
Question:
Using Exhibit 12-2, determine the average number of additional years males alive at age 35 may expect to live.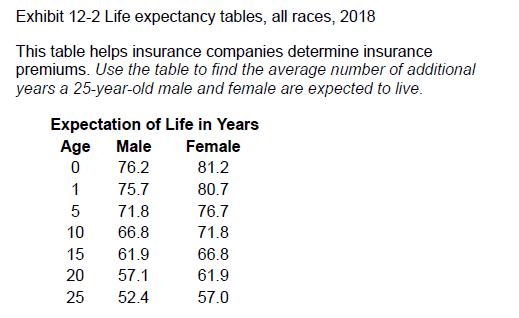
Fantastic news! We've Found the answer you've been seeking!
Step by Step Answer:
Based on the life expectancy tables youve provided t...View the full answer

Answered By
Brown Arianne
Detail-oriented professional tutor with a solid 10 years of experience instilling confidence in high school and college students. Dedicated to empowering all students with constructive feedback and practical test-taking strategies. Effective educator and team player whether working in a school, university, or private provider setting. Active listener committed to helping students overcome academic challenges to reach personal goals.
2+ Reviews
10+ Question Solved
Related Book For 

Personal Finance
ISBN: 9781264101597
14th Edition
Authors: Jack Kapoor, Les Dlabay, Robert Hughes, Melissa Hart
Question Posted:
