

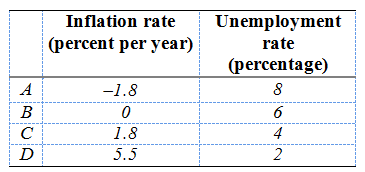
In 2017, the outcome turned out to be row D of the left side table. Plot the
Question:
Fantastic news! We've Found the answer you've been seeking!
Step by Step Answer:
Use the table above to plot the Phillips curve The table is construc...View the full answer

Answered By
Muhammad Salman Alvi
Well, I am a student of Electrical Engineeing from Information Technology University of Punjab. Just getting into my final year. I have always been good at doing Mathematics, Physics, hardware and technical subjects. Teaching profession requires a alot of responsibilities and challenges.
My teaching experience started as an home tutor a year ago. When I started teaching mathematics and physic subjects to an O Level student. He was about 14 years old. His name was Ibrahim and I used to teach him for about 2 hours daily. Teaching him required a lot of patience but I had to be polite with him. I used to give him a 5 min break after 1 hour session. He was quite weak in basic maths and calculation. He used to do quite a lot of mistakes in his homework which I gave him weekly. So I decided to teach him basics from scratch. He used to say that he got the concept even if he didn't. So I had to ask him again and again. I worked on his basics for a month and after that I started taking a weekly test sesions. After few months he started to improve gradually. Now after teaching him for about a year I can proudly say that he has improved alot. The most important thing was he managed to communicate all the difficullties he was facing. He was quite capable and patient. I had a sincere desire to help him reach to its full potential. So I managed to do that. We had a very good honest relationship of a student and a teacher. I loved teaching him as a tutor. Now having an experience of one year teaching I can read students quite well. I look forward to work as an online tutor who could help students in solving their all sort of difficulties, problems and queries.
29+ Reviews
43+ Question Solved
Related Book For 
Question Posted:
