

Table 3 provides data on the price of hot chocolate, the temperature, and the number of cups
Question:
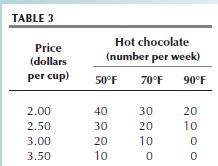
Table 3 provides data on the price of hot chocolate, the temperature, and the number of cups a week. Draw graphs to show the relationship between
• The price and the number of cups of hot chocolate, when the temperature is constant.
• The temperature and the number of cups of hot chocolate, when the price is constant.
Table 3
Step by Step Answer:

This question has not been answered yet.
You can Ask your question!
Related Book For 
Question Posted:
