

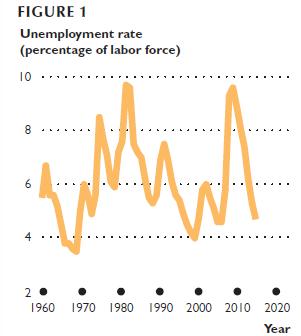
1. Figure 1 shows the unemployment rate in the United States from 1960 to 2016. In which...
Question:
1. Figure 1 shows the unemployment rate in the United States from 1960 to 2016. In which decade—the 1960s, 1970s, 1980s, 1990s, or 2000s—was the average unemployment rate the lowest and what brought low unemployment in that decade? In which decade was the average unemployment rate the highest and what brought high unemployment in that decade?
2. Describe the trends in the labor force participation rates of men, women, and all working-age people.
Fantastic news! We've Found the answer you've been seeking!
Step by Step Answer:
1 Figure 1 shows that the unemployment rate was lowest during the 1960s when defense spen...View the full answer

Answered By
Tamil Elakkiya Rajendran
I'm currently involved in the research in the field of Biothermodynamics, Metabolic pathway analysis and computational Biology. I always prefer to share my knowledge whatever I have learnt through my degree whenever time permits.
2+ Reviews
10+ Question Solved
Related Book For 

Question Posted:
