

Figure 1 shows the demand curve for DVDs and the market price of a DVD. 1. What
Question:
Figure 1 shows the demand curve for DVDs and the market price of a DVD.
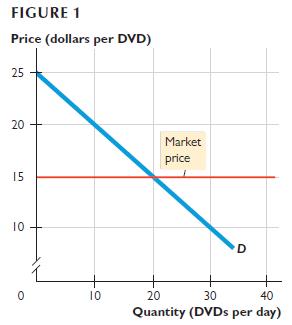
1. What is the willingness to pay for the 20th DVD? Calculate the value of the 10th DVD and the consumer surplus on the 10th DVD.
2. What is the quantity of DVDs bought? Calculate the consumer surplus, the amount spent on DVDs, and the total benefit from the DVDs bought.
3. If the price of a DVD rises to $20, what is the change in consumer surplus?
Fantastic news! We've Found the answer you've been seeking!
Step by Step Answer:
1 The willingness to pay for the 20th DVD is the price on the demand curve at 20 DVDs which is 15 Fi...View the full answer

Answered By
Nazrin Ziad
I am a post graduate in Zoology with specialization in Entomology.I also have a Bachelor degree in Education.I posess more than 10 years of teaching as well as tutoring experience.I have done a project on histopathological analysis on alcohol treated liver of Albino Mice.
I can deal with every field under Biology from basic to advanced level.I can also guide you for your project works related to biological subjects other than tutoring.You can also seek my help for cracking competitive exams with biology as one of the subjects.
2+ Reviews
10+ Question Solved
Related Book For 

Question Posted:
