

Look at Table 12.1 and Figure 12.7 in the text. When were T-bill rates at their highest
Question:
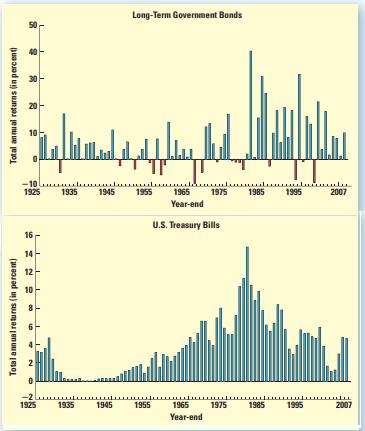
Look at Table 12.1 and Figure 12.7 in the text. When were T-bill rates at their highest over the period from 1926 through 2007? Why do you think they were so high during this period? What relationship underlies your answer?
Table 12.1:
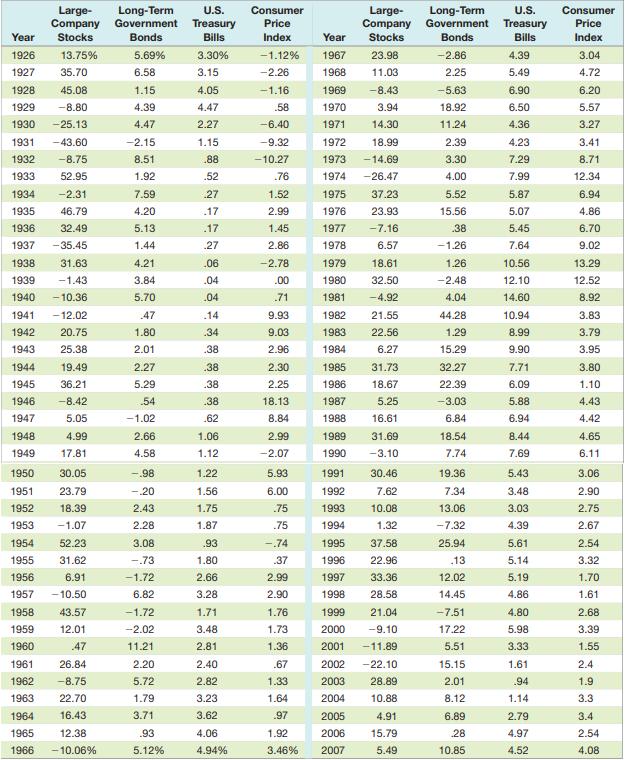
Figure 12.7:
Fantastic news! We've Found the answer you've been seeking!
Step by Step Answer:
ANSWER From the given table and figure in the year 1985 Tbill rates are at highest ov...View the full answer

Answered By
Antony Sang
I am a research and academic writer whose work is outstanding. I always have my customer's interests at heart. Time is an important factor in our day to day life so I am always time conscious. Plagiarism has never been my thing whatsoever. I give best Research Papers, Computer science and IT papers, Lab reports, Law, programming, Term papers, English and literature, History, Math, Accounting, Business Studies, Finance, Economics, Business Management, Chemistry, Biology, Physics, Anthropology, Sociology, Psychology, Nutrition, Creative Writing, Health Care, Nursing, and Articles.
2+ Reviews
10+ Question Solved
Related Book For 
Fundamentals of corporate finance
ISBN: 978-0073382395
9th edition
Authors: Stephen Ross, Randolph Westerfield, Bradford Jordan
Question Posted:
