

Look at Table 12.1 and Figure 12.7 in the text. When were T-bill rates at their highest
Question:
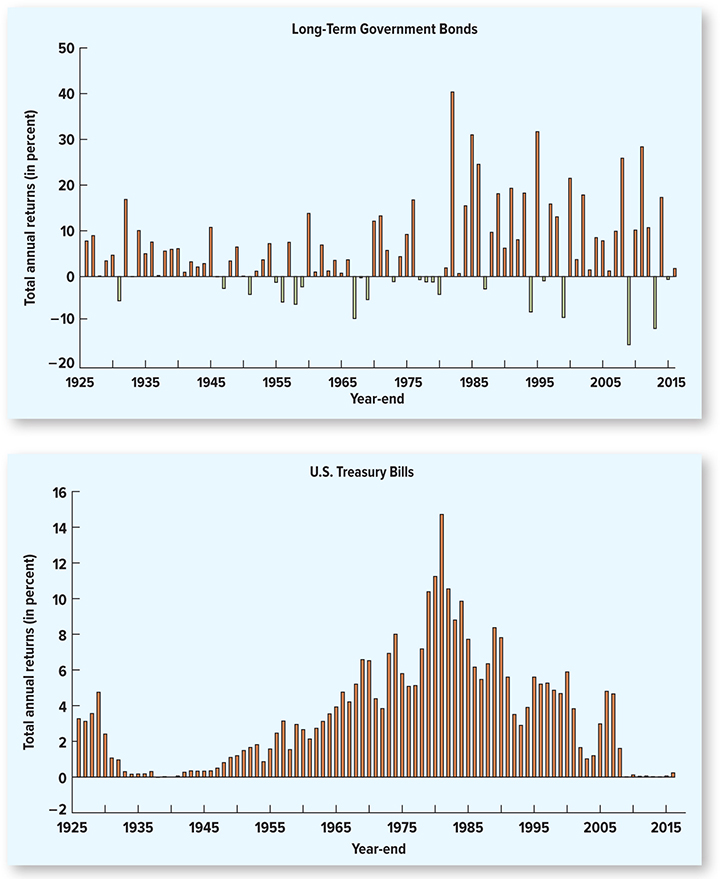
Look at Table 12.1 and Figure 12.7 in the text. When were T-bill rates at their highest over the period from 1926 through 2016? Why do you think they were so high during this period? What relationship underlies your answer?
Table 12.1
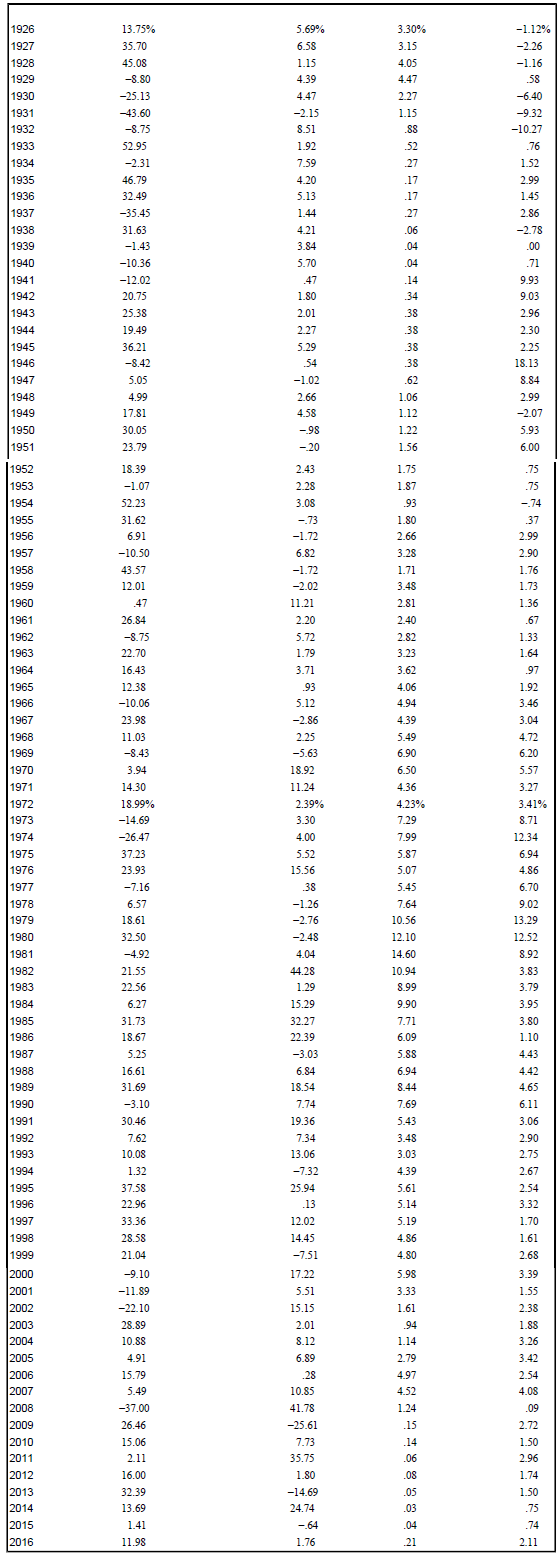
Figure 12.7
Fantastic news! We've Found the answer you've been seeking!
Step by Step Answer:
Tbill rates were highest ...View the full answer

Answered By
Branice Buyengo Ajevi
I have been teaching for the last 5 years which has strengthened my interaction with students of different level.
1+ Reviews
10+ Question Solved
Related Book For 
Fundamentals of Corporate Finance
ISBN: 978-1260153590
12th edition
Authors: Stephen M. Ross, Randolph W Westerfield, Robert R. Dockson, Bradford D Jordan
Question Posted:
