The following information is available for Claires Stores from January 2013 through January 2017. In the last
Question:
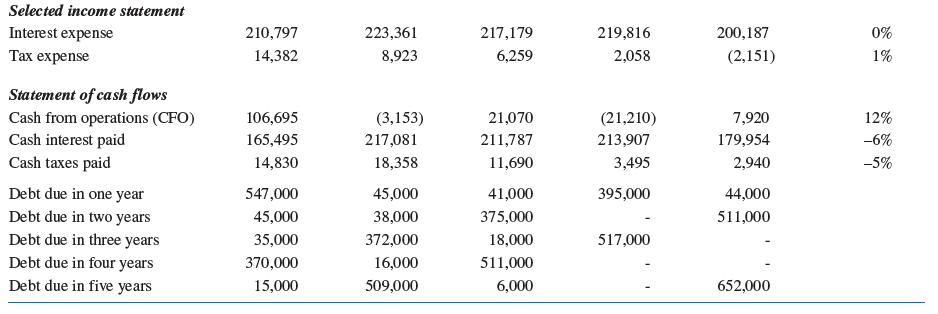
The following information is available for Claire’s Stores from January 2013 through January 2017. In the last column, the median industry values are reported for apparel and accessory stores. Assets and revenues are in millions of dollars, balance sheet percentages are a percentage of total assets, income statement percentages are a percentage of total revenues, and the statements of cash flow percentages are a percentage of total assets.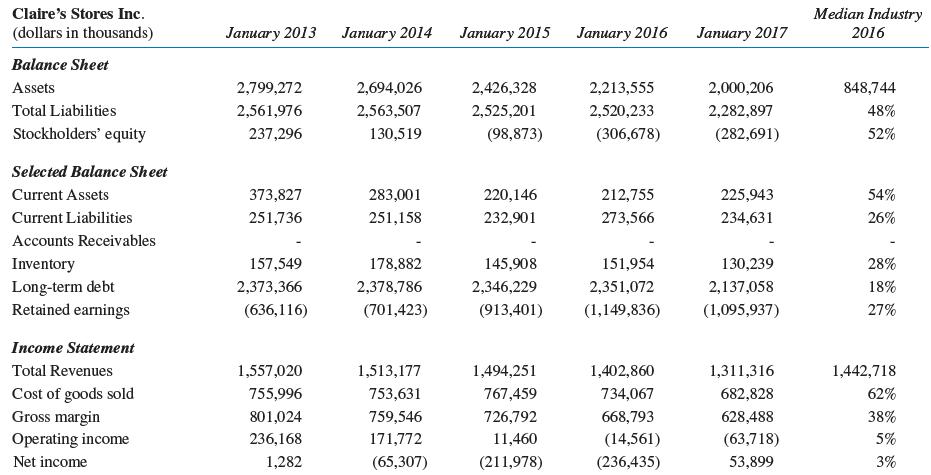
Required:
1. Evaluate the performance of Claire’s Stores over time. Is there a year, where you first become concerned about the likelihood of bankruptcy?
2. Because Claire’s is a private company, the market value of equity is unknown. Compute the Z- score for private firms. Make an assessment of the likelihood of bankruptcy during 2018.
Step by Step Answer:
To evaluate the performance of Claires Stores over time and assess the likelihood of bankruptcy we can use financial ratios and the Altman Zscore whic...View the full answer